What separates the top from the rest
The top teams and the bottom teams build the same class of machine: four or six wheels, passive articulation, an arm, a camera mast and a laptop at a command station. What separates them is a machine that works on the day, not a better idea. Across 162 finals team-years from 2022 to 2026, a team with no zero mission averages rank 10.2, one zero costs about 11 places, and the written review, the System Acceptance Review or SAR, explains 2.8 % of the spread while three missions explain 82.6 % S-URC-RESULTS. This page sets out the evidence for that claim, the factors that survive a causal test, and the factors that do not.
Key takeaways
- The bottom group is not slightly worse at everything. It is a normal science team (68.7, a gap of 20.8) with a broken manipulator (9.8) and no autonomy (3.7).
- One zero is a step, not a slope: mean rank 10.2 with none, 21.1 with one, 29.2 with two. The 2026 top eight scored all 32 of 32 mission-runs.
- The review is the wrong place to look for a ranking lever. It is worth 100 points and decides the field, but it has never explained more than 5.7 % of the spread in nine years.
- Framework fashion, team size, open-source output and one-year rank jumps carry no signal. The copyable behaviour is rehearsal and a no-zero discipline.
Two comparison sets and what they measure
All values come from the five official score sheets for 2022 to 2026 S-URC-RESULTS S-URC22-SCORES S-URC23-SCORES S-URC24-SCORES S-URC25-SCORES S-URC26-SCORES. A team-year enters a mean only when the team competed and recorded a total, and the 25 rows that carry a review score and no mission score are analysed separately.
Set A compares the top five and the bottom ten by mean finals total over 2022 to 2026, restricted to the 44 of 62 finals teams with at least two appearances so that a single visit cannot define either end. Set B compares the 2026 top eight with places 9 to 36. The cut at eight is not arbitrary: it separates the only eight teams above 300 points, and the gap from 8th (324.59) to 9th (274.91) is 49.68 points, the widest in the table apart from first to second.
| Comparison | Sample | Mean total | Mean SAR |
|---|---|---|---|
| Top five by mean, 2022–2026 | 5 teams, 23 team-years | 354.6 | 93.03 |
| Bottom ten by mean, 2022–2026 | 10 teams, 26 team-years | 178.7 | 87.86 |
| 2026 top eight | 8 teams | 382.1 | 88.91 |
| 2026 places 9 to 36 | 28 teams | 203.1 | 84.85 |
The mean final ranks of the two five-year sets are 4.6 and 27.3. The top five by mean are Missouri S&T (378.5), WVU (371.7), Monash (343.1), Michigan (336.4) and AGH (336.0). The bottom ten run from Binghamton (195.8) to Team Interplanetar (157.6). Both sets are populations of convenience, not samples, and the next section shows why the gap between them is mostly three missions.
Sample
Means are finals-only and cover 162 team-years across five editions. The 25 review-only rows are excluded from every mean on this page and are discussed on their own below. The within-season spread uses the same team-years; the year-to-year spread uses the 28 teams with at least three appearances.
The gap is in three hard missions, not the review
| Component | Top five (n = 23) | Bottom ten (n = 26) | Gap | 2026 top eight | 2026 places 9–36 | 2026 gap |
|---|---|---|---|---|---|---|
| SAR | 93.03 | 87.86 | +5.17 | 88.91 | 84.85 | +4.05 |
| Science and astrobiology | 89.53 | 68.69 | +20.83 | 93.88 | 74.05 | +19.83 |
| Delivery | 53.67 | 9.27 | +44.40 | 63.50 | 11.24 | +52.26 |
| Equipment servicing | 59.02 | 9.84 | +49.18 | 64.94 | 18.90 | +46.04 |
| Autonomous navigation | 59.39 | 3.71 | +55.68 | 70.90 | 14.07 | +56.83 |
| Total | 354.6 | 178.7 | +175.9 | 382.1 | 203.1 | +179.0 |
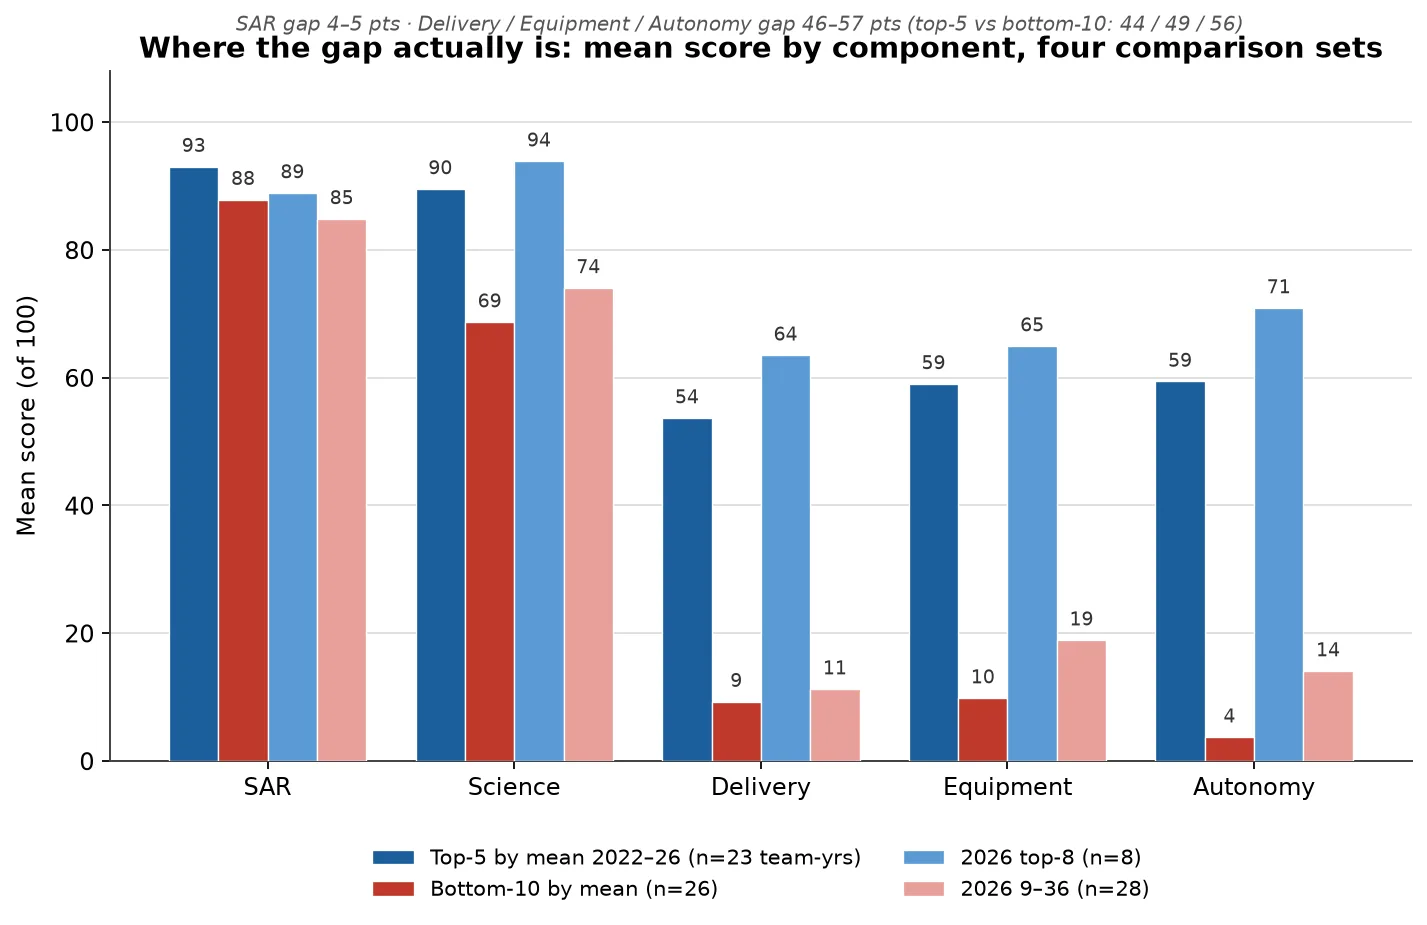
The direction matters more than the size. Lifting each hard mission by 20 points gains more than lifting the SAR by 5, because the four mission scores are not independent: all four need a rover that drives, so the gaps are diagnostic rather than additive. The bottom-ten profile is a team that can do science and cannot manipulate or navigate. That is a capability threshold, not a slope.
The decomposition and the zero rate for each component belong in one table, because a mission that is often zero is also the mission that moves the total.
| Component | Share of finals-total variance | Zero share, 2022–2026 |
|---|---|---|
| Autonomous navigation | 30.6 % | 41.4 % |
| Equipment servicing | 27.7 % | 16.7 % |
| Delivery | 24.3 % | 15.4 % |
| Science and astrobiology | 14.4 % | 0 % |
| Review | 2.8 % | 0 % |
The shares are an upper bound on each mission’s causal weight, because a team that zeroes everything carries covariance with three missions at once. The ordering is robust under every tie treatment of the underlying ranks, even when individual correlations move: in 2023 Delivery, 14 of 31 teams scored exactly 15, and the correlation for that mission moves from 0.69 to 0.87 depending on how the tie is broken S-URC-RESULTS.
The review gates the field, then stops predicting
The review is worth 100 of the 500 points and it sets the field: about one registered team in three is invited, and a team outside the top 36 never competes S-URC27-RULES §3.a.iii. Of its 100 points, 48 are the video, 40 the report and 12 the judges’ assessment S-URC26-SAR. Once a team is inside the field, the review stops discriminating. Its pooled rank correlation is +0.48, the weakest of the five components, and its Pearson correlation with the final total is −0.42. It has never explained more than 5.7 % of the spread in nine years, and 2.8 % pooled over 2022 to 2026 S-URC-RESULTS.
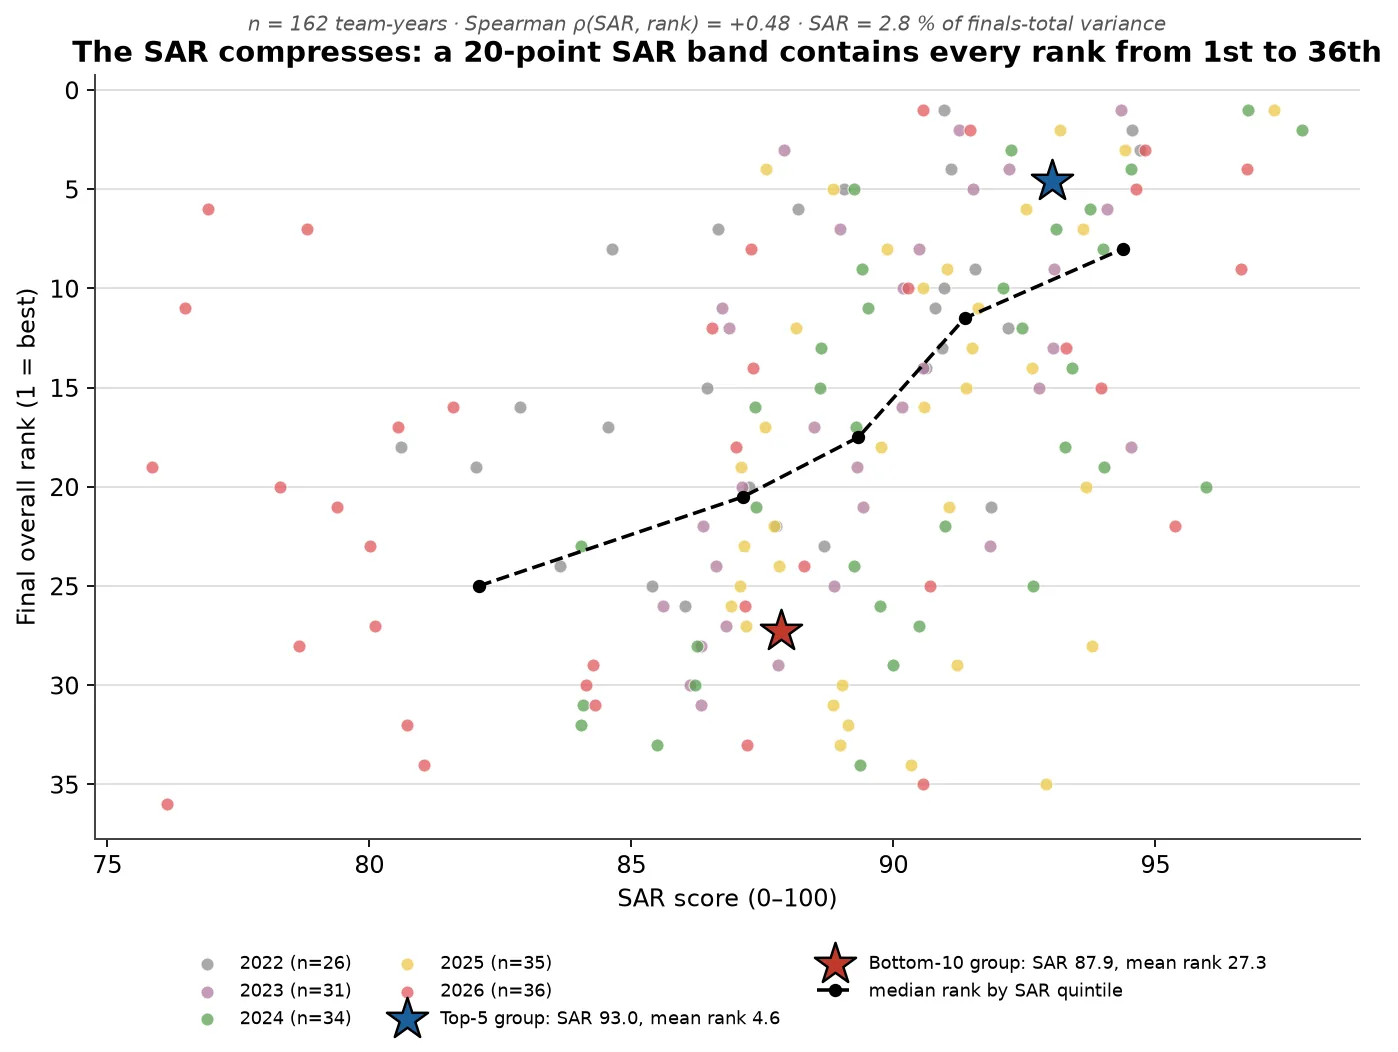
The 2026 field makes the point bluntly. The winner, Missouri S&T, had the 10th-highest review score (90.57). KNR had the second-highest (96.63) and finished 9th. MR2/KAIST had the third-highest (95.38) and finished 22nd. The inverse also happens: BRACU was 30th on the review (78.81) and finished 7th; Northeastern was 33rd (76.93) and finished 6th S-URC26-SCORES. A respectable review is also not evidence that a team reached the field. The 25 team-years with a review score and no mission score average 88.28, range 80.17 to 93.07, and 12 of the 25 sit above the median of that year’s finals field. Whether those rows are withdrawals or teams that cleared the cut and were not admitted cannot be settled from the sheets.
One zero is a step change, not a slope
| Missions scored exactly zero | Team-years | Mean final rank | Mean final total |
|---|---|---|---|
| 0 | 83 | 10.2 | 297.9 |
| 1 | 50 | 21.1 | 212.8 |
| 2 | 18 | 29.2 | 158.4 |
| 3 | 11 | 28.0 | 152.2 |
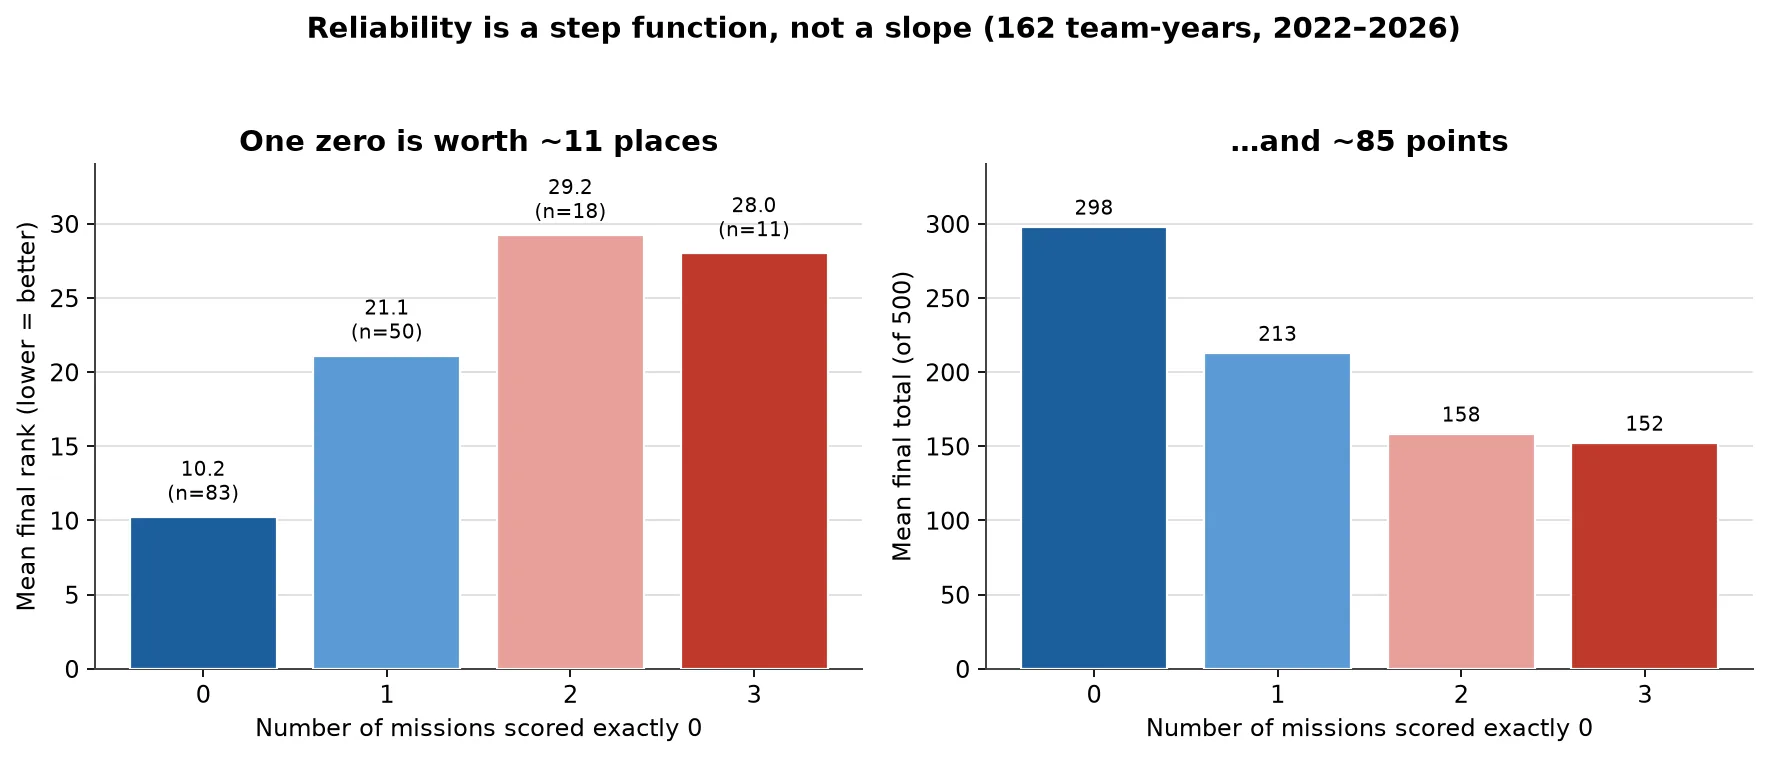
The effect is not confined to weak teams. The 2026 top eight scored a non-zero on all four missions, 32 of 32 mission-runs. The other 28 teams produced 33 zeros in 112 runs, 12 of them in Delivery and 16 in Autonomy. A zero is worth between 9.7 and 14.0 places depending on the mission: mean rank 15.4 with a Delivery zero against 25.1 without, 14.6 against 28.6 for Equipment, and 11.7 against 24.3 for Autonomy. The Autonomy gap stays between 11.9 and 15.2 places in every year from 2022 to 2026 S-URC-RESULTS. Two of the top-five Autonomy zeros belong to Monash in 2024 and AGH in 2023, both otherwise podium-class that year. A subsystem failure is not a weakness of weak teams.
Consistency is the floor, not the ceiling
Two measures of consistency give opposite answers, and the difference is the finding.
| Set | Within-season mission SD | Year-to-year total SD |
|---|---|---|
| Top five by mean | 22.4 | 52.3 |
| Bottom ten by mean | 27.3 | 26.4 |
| 2026 top eight | 16.2 | single year |
| 2026 places 9 to 36 | 27.9 | single year |
The top five are more variable year to year than the bottom ten, because the bottom is pinned near the floor. Across the 28 teams with at least three finals appearances, mean total and year-to-year SD correlate at +0.56: in this dataset, better teams are more variable, not less. The most consistent totals belong to KARURA (SD 5.6, mean 191), TMR (10.2, mean 256) and Project Scorpio (10.7, mean 246), all mid-field or lower; the most volatile include Missouri S&T (58.8), Monash (56.6) and WVU (53.9), which are the winners S-URC-RESULTS. What the top teams do not do is zero a mission. A flat four-mission profile in 2026 is a consequence of four working missions, not an independent virtue.
The top is a small, changing club
| Team | 2022 | 2023 | 2024 | 2025 | 2026 |
|---|---|---|---|---|---|
| Missouri S&T | 371 (3) | 298 (6) | 342 (4) | 412 (1) | 470 (1) |
| WVU | 269 (10) | 425 (1) | 392 (2) | 396 (2) | 377 (4) |
| Monash | 381 (2) | 355 (2) | 247 (16) | 321 (7) | 412 (2) |
| Michigan | 389 (1) | 343 (4) | 274 (9) | 300 (11) | 376 (5) |
| AGH | 341 (4) | 274 (8) | 393 (1) | no finals result | no finals result |
| UIU | 237 (13) | 274 (9) | 304 (5) | 326 (6) | 400 (3) |
| Northeastern | 208 (16) | 257 (13) | 272 (10) | 362 (3) | 350 (6) |
| Sooner | 272 (7) | 260 (12) | 238 (19) | 180 (32) | no finals result |
Finals totals out of 500, with final rank in brackets. Every repeat winner and podium team also had a sub-300 season inside the five years.
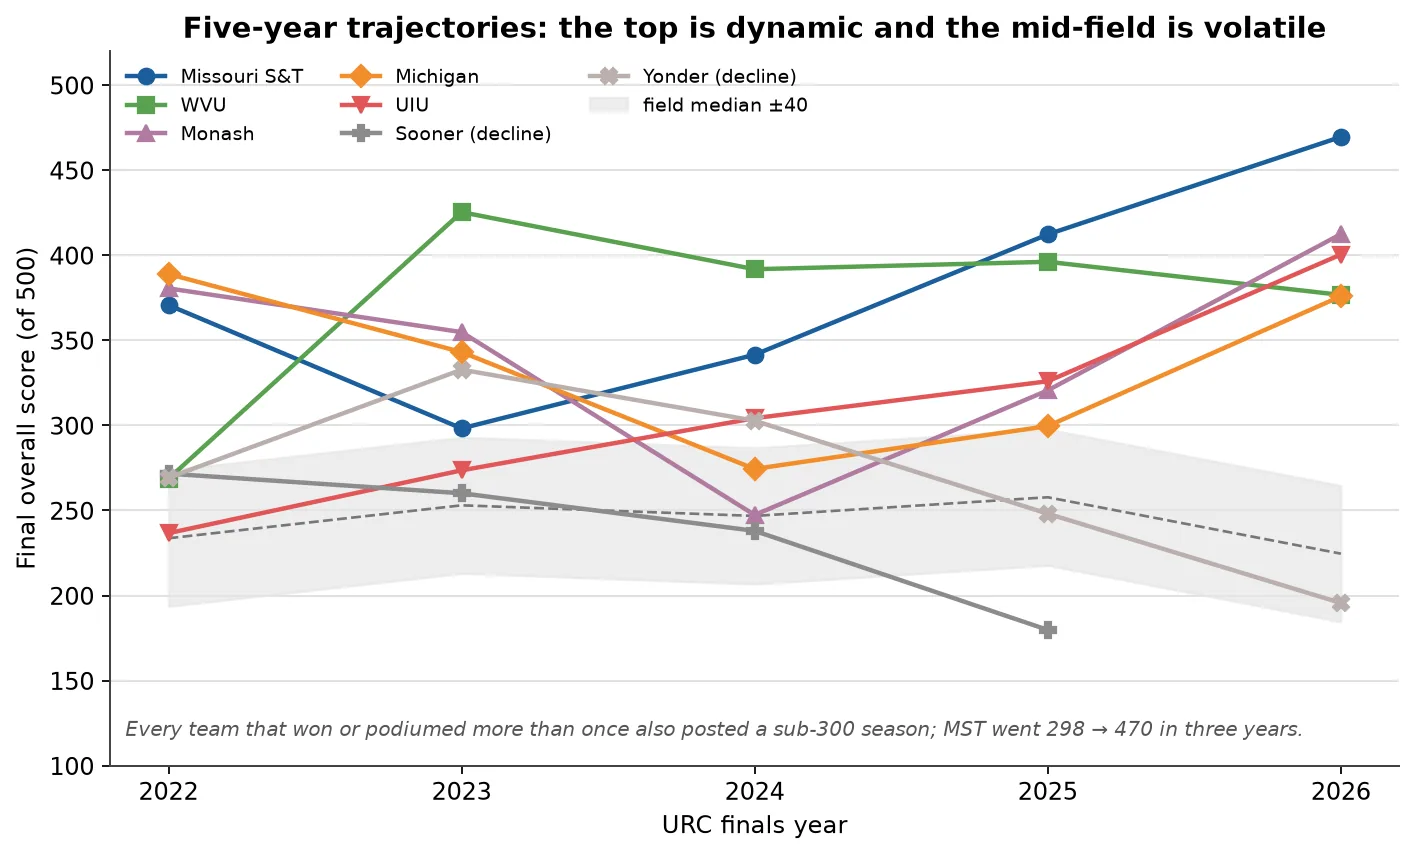
The interactive version plots the same seven totals, without the median band.
Four distinct teams won the five editions and eight distinct teams filled the fifteen podium places. Thirteen teams appear in every edition, and 11 of those recorded a finals score every year S-URC-RESULTS. The top is not a closed group, but it is a small one, and the way in is not a single good year: UIU’s rise is a change of +1.91 in within-year z-score, and the team publishes no code. Platform-change years cost a season in the two best-documented cases. Monash fitted a new arm and a new autonomy stack in the same year and scored 18 on Equipment and 0 on Autonomy, falling to 16th. Missouri S&T lost the 2023 Delivery stage gate and then a signal stack and an arm axis in 2024 before winning in 2025 and 2026 S-MONASH-SAR2026 S-MST-NEWS2023 S-MST-NEWS2024.
Returns also track position, but the gradient is survivorship, not learning. One finals appearance averages 179.6, five appearances average 303.9, and the teams that keep returning are the ones that were good enough to keep travelling. The cleanest natural experiment is a first appearance in the window: in 2026 the six first-time teams finished 22nd, 26th, 32nd, 34th, 35th and 36th, averaged 161.1 against 259.2 for the 30 returning teams, and none finished in the top half S-URC-RESULTS.
Mass is a marker of maturity, not a cause of score
Mass correlates with score, and the correlation fails every causal test applied to it. Over the 12 competition configurations with a published mass and a finals total, Spearman ρ is −0.60 at p = 0.04; normalised within year it is −0.52 at p = 0.08; excluding the two inferred masses it is −0.72 at p = 0.02; and leave-one-out values stay between −0.48 and −0.75 S-URC-RESULTS. The association is real in this sample. The mechanism is not mass.
| Team and years | Mass change | Score change |
|---|---|---|
| UIU, 2022 to 2026 | −2.3 kg | +164 points |
| WVU, 2022 to 2023 | −20 kg | +157 points |
| Northeastern, 2025 to 2026 | −5 kg | −12 points |
| BRACU, 2025 to 2026 | +2 kg | +30 points |
The mission decomposition is backwards from the physics. The most mass-sensitive mission, Delivery, correlates weakest with mass (−0.46, p = 0.13), and Equipment Servicing, whose workload barely depends on mass, correlates as strongly as the total (−0.61, p = 0.03); Autonomy is −0.67 (p = 0.02) and Science is −0.12 (p = 0.70). Heavy teams are heavy because the design did not converge, and the same failure costs points everywhere. There is also no interior optimum in the observed range: the 33 kg winner of 2023 S-WVU-SAR2023 and the 42 to 50 kg cluster both score in the 200 to 425 band. The limit is a constraint, not a target. The useful question is not how heavy the rover is but how much reserve it carries, because the last 3 kg of a first build arrive in the final six weeks.
Causal candidates, consequences and noise
The test applied here is stated so that it can be attacked. A causal candidate needs a mechanism that operates before the outcome, the right timing, and a dose-response or a natural experiment. A consequence is plausibly produced by winning. Noise behaves like a draw.
| Factor | Status | What the record shows | What a first build takes from it |
|---|---|---|---|
| No-zero reliability | Causal candidate, strongest | Rank 10.2 with no zero, 21.1 with one, 29.2 with two; the 2026 top eight 32 of 32 non-zero | Zero avoidance is the first design filter, ahead of performance |
| A link that works at the site | Causal candidate | No bottom-eight team reached 60 on a teleoperated mission in 2024, 2025 or 2026 (0 of 8 each year); obstructed range is about one-fifth of line of sight (850 m to 300 m, 750 m to 164 m) | Two bands, a 2 to 3 m mast, a directional base and one deliberate out-of-sight test |
| Autonomy that completes the course | Causal candidate | 67 of 162 team-years zeroed; rank 11.7 against 24.3; a 2026 gap of +56.8 | One conservative planner, a progress checker and ten cold-boot full-length runs |
| Manipulator precision | Causal candidate | Highest pooled rank correlation of any mission (ρ = 0.77); top-five mean 59.0 against bottom-ten 9.8 | A wrist camera, a panel-parallel prismatic axis and task-specific end effectors |
| Rehearsal | Causal candidate, weak measurement | WVU publishes 30, 50+ and 100 operator hours in different documents; UIU reports 80+ hours of drive time | The structure (timed mock missions, a replica lander, degraded modes), not the number |
| Analogue-terrain testing | Causal candidate | Tucumcari and Hanksville campaigns, a beach test, coal-ash fields | One off-campus campaign before the review video |
| Mass discipline and weigh-in margin | Causal candidate, thin evidence | ρ = −0.60, but within-team mass changes explain none of the score change | 4 kg of margin, not a ranking lever |
| Factor | Why it is downstream | The counterexample |
|---|---|---|
| Team size | Winning attracts members and institutional support | Size is known for 4 of 62 teams S-CENSUS; WVU won with 50 members in 2023 S-WVU-SAR2023 and finished 4th with more than 80 in 2026 S-WVU-SAR2026 |
| Documentation volume | A documentation subteam needs continuity and spare capacity | The three teams with a full public report set average 344.2 S-CENSUS S-URC-RESULTS, but one of them, BRACU, finished 7th in 2026 and 21st in 2024 S-URC-RESULTS |
| Open-source output | Publishing follows slack and staff, not the reverse | UIU publishes no code and finished 3rd in 2026; BYU publishes none |
| A drone or a specialised instrument | Discretionary projects appear after the base platform works | Missouri S&T’s 2024 drone never flew; the Raman instrument moved its Science score 96 → 79 → 82 → 96 → 93 across 2022 to 2026 |
Four more candidates are noise or an artefact, and none should carry a theory:
- One-year rank swings. ARES went 30 → 8, UdeG 35 → 14 and Sooner 7 → 32. A single jump is not a method.
- The 2026 Autonomy tie at 86. Five teams scored exactly 86 and they are exactly ranks 1 to 5. The 2026 Autonomy column holds only six distinct non-zero values across 36 teams, so the podium was decided by the other four components.
- Penalties. One finals row in 187 carries a non-empty penalty cell (UdeG 2025, 16.39). Penalties are a rules risk, not a score driver.
- Planner sophistication. Monash went 70 → 0 → 14 → 86 while simplifying, and UMD Loop’s textbook Nav2 configuration finished 32nd of 36 in 2026 S-MONASH-SAR2026.
The strongest counter-reading
A team that zeroes one mission loses about 85 points, but the sheets cannot distinguish a mission that was attempted and failed, one that was not attempted and one that was withdrawn. The reliability claim is a statistical pattern, not a failure taxonomy. The per-mission failure evidence sits on How rovers fail.
What this comparison cannot show
The sets are populations of convenience: five top teams, ten bottom teams and four documented programmes, all four of them Tier A and all four in the 2026 top eight. There is no bottom-ten dossier, so the qualitative half of this page reports what winners do, not what losers fail to do. Everything is correlational except the arithmetic identities, and two of the factors are measured weakly: the documentation rating is a first-pass check of team websites rather than a formal review S-CENSUS, and the operator-hour claims are self-reported.
Two further limits are specific to 2027. The 2026 Autonomy mission was scored in blocks, so a 2026 autonomy score is a threshold, not a continuous capability measure. The 2027 mission replaces that course with astronaut assistance and two 1 m route targets S-URC27-RULES §1.e. None of the four documented programmes describes a person-follow, gesture, sign or audio capability, so a 2027 team that copies a 2026 stack scores the route targets and forfeits the astronaut points.
What a first build takes from the record
- Zero avoidance comes before performance. One zero costs about 11 places and 85 points, more than any plausible review improvement, and the 2026 top eight had none.
- The link is a subsystem with its own test campaign. Two bands, a 2 to 3 m mast, a directional base and one deliberate test in the shadow of a hill. Obstructed range should be expected at about one-fifth of the line-of-sight figure.
- Autonomy is chosen for completion, not sophistication. One conservative planner, a progress checker and ten full-length cold-boot runs beat a cleverer stack; the 41 % zero base rate is the number to beat.
- A wrist camera and one task-specific end effector carry Equipment Servicing. The arm’s pooled rank correlation of 0.77 is the highest of any mission, and actuator brand and degrees of freedom show no signal.
- The review is completed, on time and in the required format, and then treated as insurance. It gates the field and then explains 2.8 % of the spread, so effort past a complete package buys almost nothing.
- Mass margin is kept and one major subsystem changes at a time. The record’s losses cluster in seasons where two large subsystems changed together.
Further reading
- How rovers fail works the failure record behind the zero rates.
- Mass and power carries the mass model and the reserve argument in full.
- Where the competition is going sets these findings against the rule history.
- Top versus rest gives the same statistics with definitions, samples and data links.
- Results explorer, 2022 to 2026 holds the score table every figure on this page is computed from.
- The strongest documented programmes are Missouri S&T, WVU, Monash and UIU.
Sources for this page
- S-URC-RESULTSURC official scores 2022–2026, compiled CSVPrint copy
- S-URC22-SCORESURC2022 Official ScoresOriginal
- S-URC23-SCORESURC2023 Official ScoresOriginal
- S-URC24-SCORESURC2024 Official ScoresOriginal
- S-URC25-SCORESURC2025 Official ScoresOriginal
- S-URC26-SCORESURC2026 Official ScoresOriginal Archived copy
- S-URC27-RULESUniversity Rover Challenge 2027 – Requirements and GuidelinesOriginal Archived copy
- S-URC26-SARURC2026 System Acceptance Review Requirements + SAR Q&AOriginal
- S-MONASH-SAR2026Monash Nova Rover, URC SAR 2026 (video, 5:09)Original
- S-MST-NEWS2023MRDT Winter 2023 Newsletter (PDF, 4.2 MB), URC 2023 review (belt break, Stage-1 delivery failure, rain delay) and 2024 design intentOriginal
- S-MST-NEWS2024MRDT Newsletter Winter 2024–25 (PDF, 7.5 MB), URC 2024 review with failure forensics, 2025 design update, 88 active membersOriginal
- S-WVU-SAR2023Team Mountaineers System Acceptance Review 2023 (rover "Wanderer"): Cambium PTP 450 900 MHz link, 850 m LOS / 300 m NLOS, 2 m telescoping mast, drone 900 MHz + 2.4 GHzOriginal
- S-CENSUSURC team census, master index (68 teams, 187 team-year rows, tiers, documentation test)Print copy
- S-WVU-SAR2026Team Mountaineers System Acceptance Review 2026 (rover "Deimos"): tri-modal 2.4 GHz + 5.8 GHz + 70 cm, gimbal camera on antenna mast, 750 m LOS / 164 m NLOS high-noise test, antenna + radio budget linesOriginal