Teams and hardware
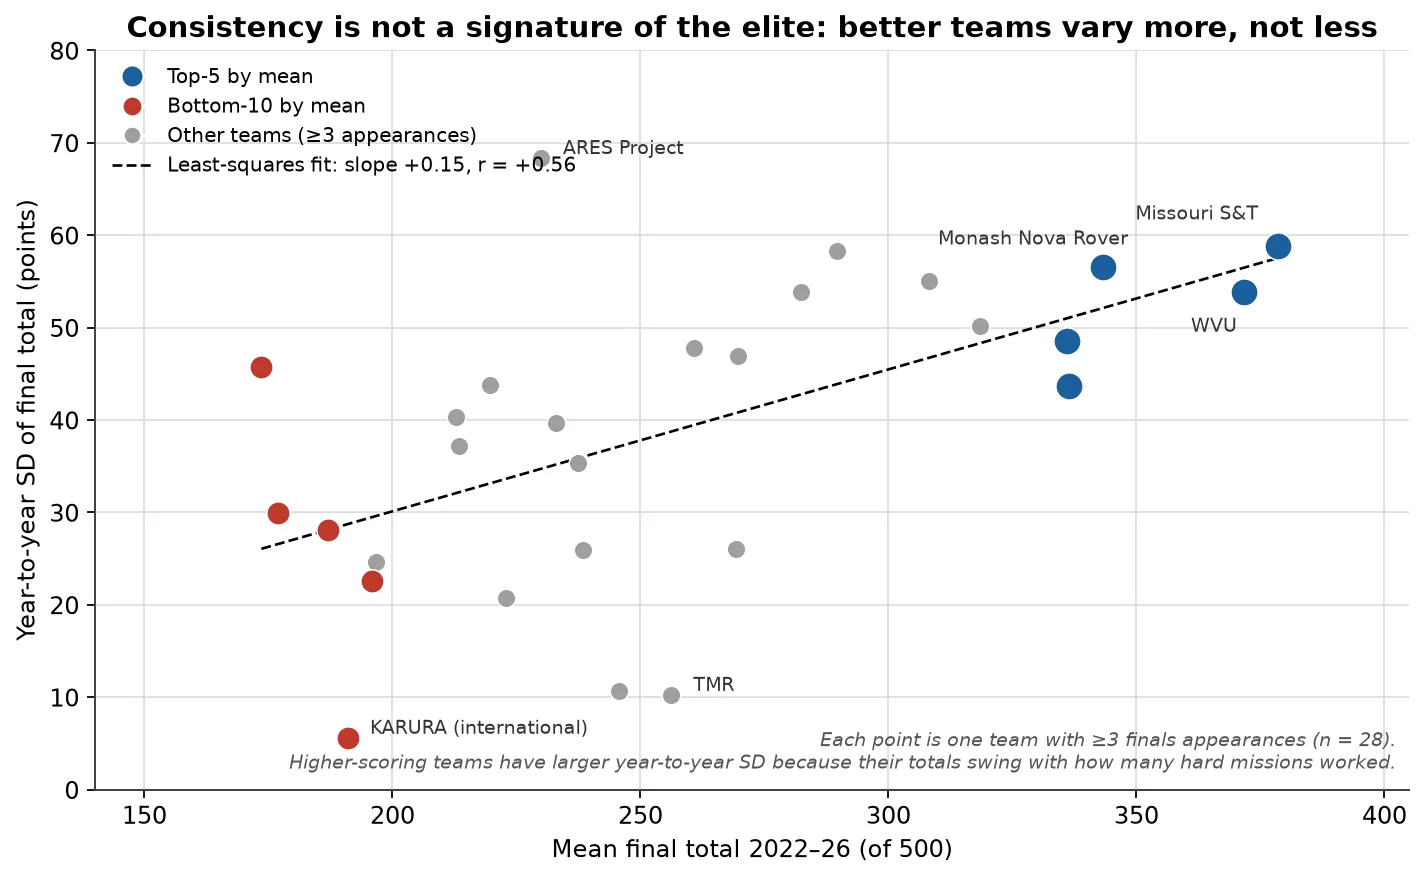
The 68 teams in the census made 187 appearances across five score sheets, and 62 of them recorded at least one finals score. Experience is the strongest descriptive variable in the dataset: teams that reached five finals averaged 303.9 points against 179.6 for a single appearance. That gradient is survivorship as much as learning, and the cleaner experiment is the first-time finalist, whose 2026 mean of 161.1 sits far below the 259.2 of the returning teams. A profile page exists for 51 of the 68 teams, and the hardware record is strongest for the four programmes below.
Key takeaways
- Experience is a survivorship gradient. Mean total rises from 179.6 with one finals appearance to 303.9 with five, but that reflects teams good enough to keep returning, not a 124-point learning curve.
- First-timers finish in the bottom half. In 2026 the six first-time teams took ranks 22, 26, 32, 34, 35 and 36, and no first-time team finished in the top half.
- Hardware has converged and the choice does not predict score. Nine of the eleven teams with public code use ROS 2, and the deliberate exception, Missouri S&T, won in 2025 and 2026 with a custom stack.
- Completion is the shared trait of the best programmes. Every top-eight team in 2026 scored all four missions; the arm, mobility and perception choices below them are variations on one architecture.
Experience
| Finals appearances | Teams | Team-years | Mean total | Mean rank percentile |
|---|---|---|---|---|
| 1 | 18 | 18 | 179.6 | 80th |
| 2 | 16 | 32 | 218.8 | 61st |
| 3 | 11 | 33 | 224.2 | 60th |
| 4 | 6 | 24 | 231.0 | 58th |
| 5 | 11 | 55 | 303.9 | 29th |
Values for the 62 teams with a finals score, 2022–2026 S-URC-RESULTS. The percentile is the mean position within each year’s field.
Thirteen of the 68 census teams appear in all five editions, and eleven of them recorded a finals score every year. At the other end, 18 teams made a single appearance. The gradient is best read as who returns rather than what experience buys: a team that keeps returning is one that was good enough to keep funding travel and recruiting.
The first-time finalist is the cleaner comparison. In 2026 the six teams with no prior finals row averaged 161.1 against 259.2 for the 30 returners, and none finished in the top half. In 2024 eight first-time teams took ranks 23 to 34. The exception is instructive: Legendary Rover finished 5th on its first appearance in the 2022–2026 window, but the team has URC history back to 2014 S-URC-RESULTS.
The four best-documented programmes
| Missouri S&T | West Virginia | Monash | UIU | |
|---|---|---|---|---|
| Middleware | Custom C++20 and RoveComm, no ROS | ROS 1 to ROS 2 | ROS 2 with Nav2 | ROS 2 with Nav2 |
| Autonomy path | C++ rewrite, LiDAR and satellite terrain | SLAM, A* and DWA; 14 to 86 between 2022 and 2026 | Hybrid A* 70, Nav2 0, Smac 14, navfn 86 | A* and EKF, RTK from 2024; 34 to 86 |
| Competition mass | Not published | 33.0 kg in 2023, with the arm | Not weighed; CAD sums 24.4 kg chassis and 6.54 kg arm | 47.5 kg in 2026, self-reported |
| Communications | 900 MHz and 2.4 and 5.8 GHz, three links | 2.4, 5.8 and 70 cm, 3 m mast, 750 m line of sight and 164 m non-line of sight | 2.4 and 5 GHz plus 900 MHz, 3 m mast | 915 MHz and 2.4 and 5.8 GHz |
| Public record | Documentation archive, no review document | Reviews, budget, code and CAD for three years | Open-source monorepo, annual video, no written review | Annual video only, no code |
Sources for the four columns are the teams’ own published material S-MST-GH-AUTONOMY S-WVU-SAR2026 S-MONASH-GH-NOVA S-UIU-2026-SAR. All four are Tier A and all four finished in the top eight in 2026, so the table describes what the winners do, not what the rest fail to do.
What the hardware record shows
Middleware is convergent and not decisive. Nine of the eleven teams with public code use ROS 2 somewhere, but Missouri S&T won 2025 and 2026 on a custom UDP and TCP protocol and a C# base station. Planner sophistication did not track score either: Monash’s custom hybrid-A* scored 70 in 2023, a ground-up Nav2 rebuild scored 0 in 2024, a state-lattice version scored 14 in 2025 and a conservative Nav2 stack scored 86 in 2026. UMD Loop publishes the most canonical Nav2 configuration in the corpus and finished 32nd of 36 in 2026 S-URC26-SCORES S-MONASH-SAR2024 S-MONASH-SAR2026.
Wheel count follows the mass budget. Six wheels with passive articulation is the norm, but UIU dropped from six wheels to four in 2026 explicitly to overcome mass constraints and maximise payload capacity, and moved from 6th to 3rd. The choice is a trade, not a doctrine S-UIU-2026-SAR.
Every documented top team runs two or more independent link planes. Non-line-of-sight range collapses to about one-fifth of line-of-sight in the teams’ own measurements: 850 to 300 m in 2023 and 750 to 164 m in 2026. Communications is also the subsystem the judges name as the most common cause of a motionless rover S-WVU-SAR2023 S-WVU-SAR2026 S-URC-ADVICE.
Most teams do not publish a mass. Four of the eight Tier A teams publish a total mass, Monash only for its 2021 rover, and one of the five champions. Missouri S&T publishes none anywhere in its public record. That absence limits what any comparison of hardware can claim S-CENSUS.
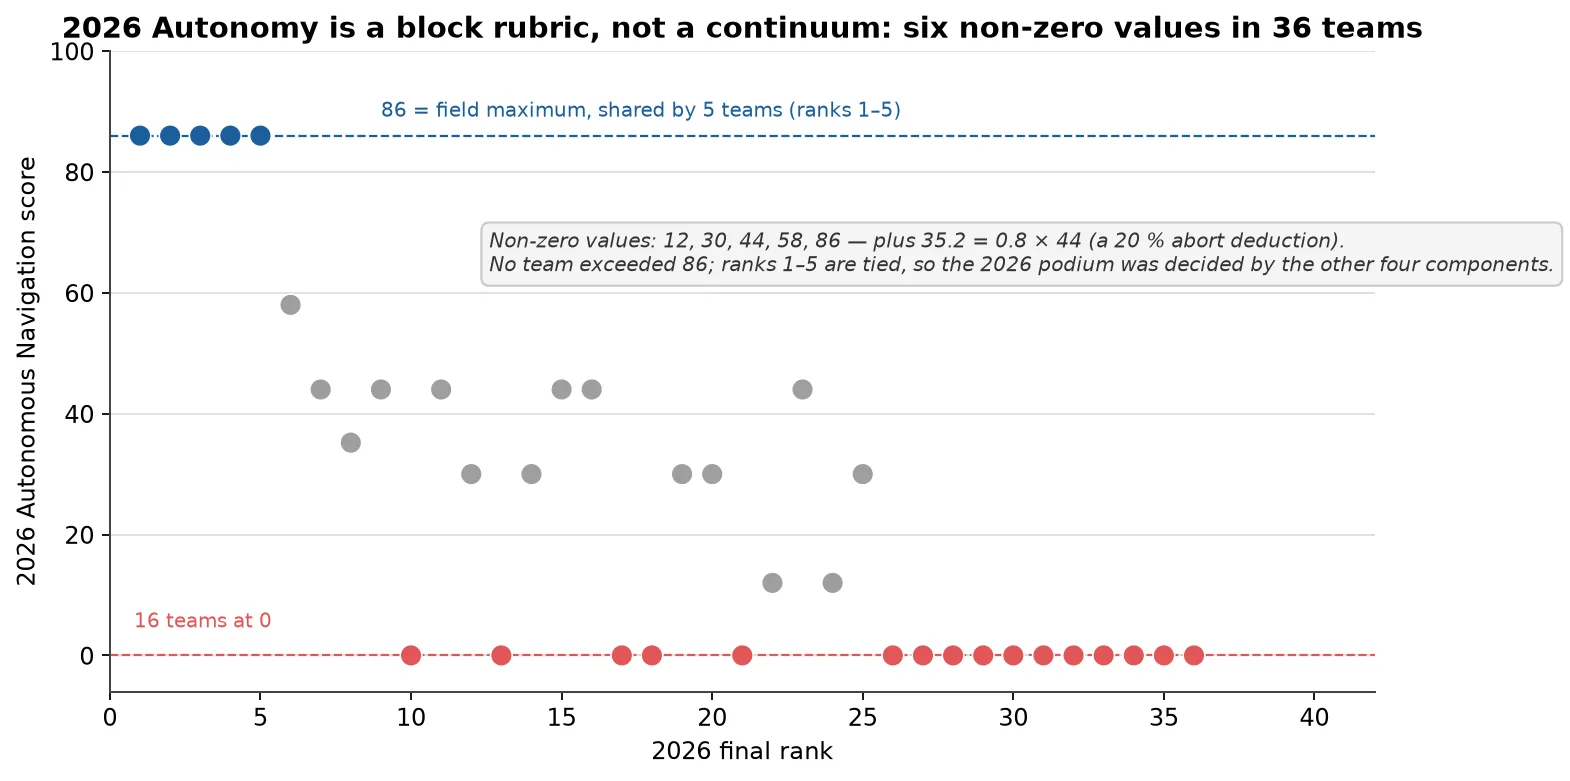
The 2026 Autonomy block is the clearest capability signal in the data. Five teams scored exactly 86 and they are exactly ranks 1 to 5; 16 teams scored zero. The top eight scored all four missions, which is what “having autonomy” looked like at the top in 2026.
The team register
The values on this page
| Statistic | Value | Definition | Period | Sample | Source | Chart and chapter |
|---|---|---|---|---|---|---|
| Teams | 68 | Distinct teams in the sheets | 2022–2026 | 187 rows | S-CENSUS | The 68-team census |
| Teams with a finals score | 62 | At least one row with mission scores | 2022–2026 | 187 rows | S-URC-RESULTS | Results explorer |
| Five appearances | 13 teams, 55 team-years | Teams in all five editions | 2022–2026 | 68 teams | S-CENSUS | The field |
| Mean total, one appearance | 179.6 | Mean of single-appearance teams | 2022–2026 | 18 teams | S-URC-RESULTS | Top versus rest |
| Mean total, five appearances | 303.9 | Mean of five-appearance teams | 2022–2026 | 11 teams | S-URC-RESULTS | Top versus rest |
| First-time finalists, 2026 | 161.1 | Mean total against 259.2 for returners | 2026 | 6 teams | S-URC26-SCORES | Chart above; The field |
Evidence note
The experience gradient is a survivorship pattern: the dataset cannot separate learning from selection, because teams that stop returning are absent from later years. “First appearance in the dataset” is not “first URC team”, since several teams have pre-2022 history outside these sheets. The hardware comparison rests on four Tier A profiles and eleven teams with public code, so counts describe documented teams and never the full field.
Sources for this page
- S-URC-RESULTSURC official scores 2022–2026, compiled CSVPrint copy
- S-MST-GH-AUTONOMYAutonomy_Software README, C++20, GPL-3.0, OpenCV 4.11 / PyTorch 2.2.2 / CUDA 12.2 / ZED SDK 4.1, Ubuntu 22.04 + JetPack 6, Docker + CIOriginal
- S-WVU-SAR2026Team Mountaineers System Acceptance Review 2026 (rover "Deimos"): tri-modal 2.4 GHz + 5.8 GHz + 70 cm, gimbal camera on antenna mast, 750 m LOS / 164 m NLOS high-noise test, antenna + radio budget linesOriginal
- S-MONASH-GH-NOVAMonashNovaRover/nova, "The Monash Nova Rover mono-repo" (Apache-2.0; default branch main; 2,389 files; last push 2026-10-23)Original
- S-UIU-2026-SARUIU Mars Rover, SAR 2026 (video; AURION, 6-wheel to 4-wheel rocker transition, spring pivot, carbon-core wheel)Original
- S-URC26-SCORESURC2026 Official ScoresOriginal Archived copy
- S-MONASH-SAR2024Monash Nova Rover, URC SAR 2024 (video, 5:07)Original
- S-MONASH-SAR2026Monash Nova Rover, URC SAR 2026 (video, 5:09)Original
- S-WVU-SAR2023Team Mountaineers System Acceptance Review 2023 (rover "Wanderer"): Cambium PTP 450 900 MHz link, 850 m LOS / 300 m NLOS, 2 m telescoping mast, drone 900 MHz + 2.4 GHzOriginal
- S-URC-ADVICEURC Advice (judges' systems-engineering lessons)Original Archived copy
- S-CENSUSURC team census, master index (68 teams, 187 team-year rows, tiers, documentation test)Print copy