The field
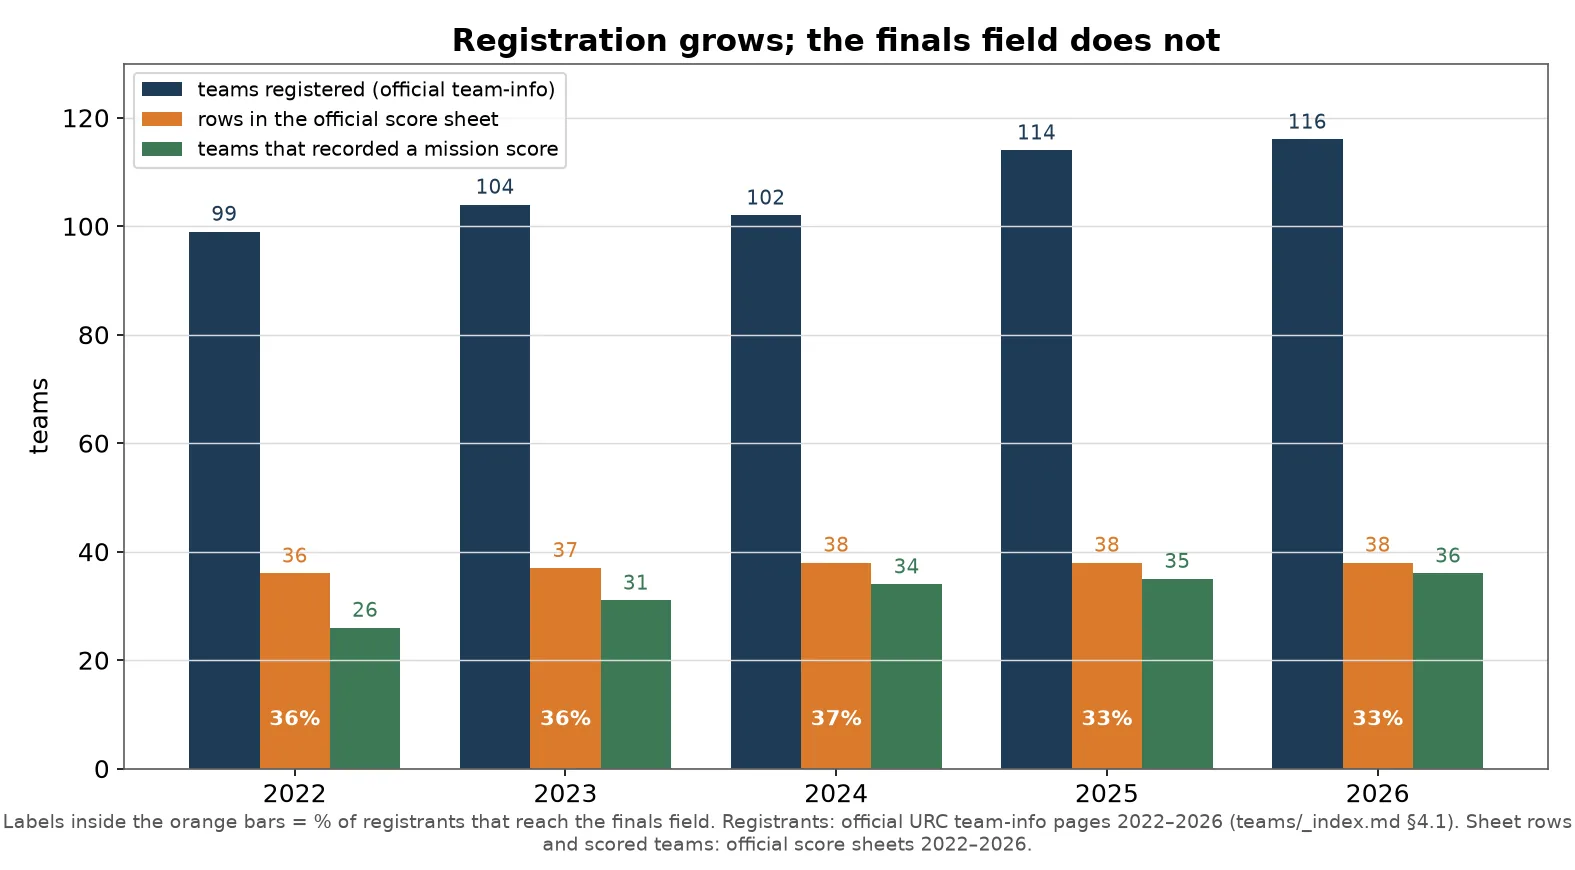
The URC field is small, stable and selected. Across the five score sheets from 2022 to 2026 there are 187 team-year rows from 68 teams: 162 rows carry finals scores and 25 carry a review score with no finals result. Registration rose from 99 teams in 2022 to 116 in 2026, while the finals field stayed at 36 to 38 rows. That gap, about one invited team for every three registrations, is the first statistic that matters to a new team.
Key takeaways
- Registration grows, the field does not. 99, 104, 102, 114 and 116 teams registered in the five years, against 36, 37, 38, 38 and 38 rows in the official sheets.
- A finals row is hard to earn and hard to keep. 25 team-years carry a review score and no finals result, including review scores in the high 80s and low 90s.
- The country mix is broad and shallow. 15 labels appear, but 10 supply the finals field in four of the five years and the United States supplies 21 of the 62 teams that scored.
- The tier rule is explicit and reproducible. Tier A is 8 teams, Tier B 24 and Tier C 36, derived from podiums, mean rank and public documentation rather than reputation.
Registration and the finals field
| Year | Teams registered | Rows in the score sheet | Teams with mission scores | Rows with a review score only |
|---|---|---|---|---|
| 2022 | 99 | 36 | 26 | 10 |
| 2023 | 104 | 37 | 31 | 6 |
| 2024 | 102 | 38 | 34 | 4 |
| 2025 | 114 | 38 | 35 | 3 |
| 2026 | 116 | 38 | 36 | 2 |
Registration counts come from the official team lists for each year S-URC22-TEAMS S-URC26-TEAMS; the row counts come from the official score sheets S-URC22-SCORES S-URC23-SCORES S-URC24-SCORES S-URC25-SCORES S-URC26-SCORES. The 2023 sheet is the check on what a row means: URC2023 featured exactly 37 finalists and the 2023 sheet has exactly 37 rows S-URC23-NEWS.
Countries
The finals draw from about ten countries a year, not from the registered field. Fifteen country labels appear across the five sheets, including one multi-country entry, and the largest single bloc is the United States.
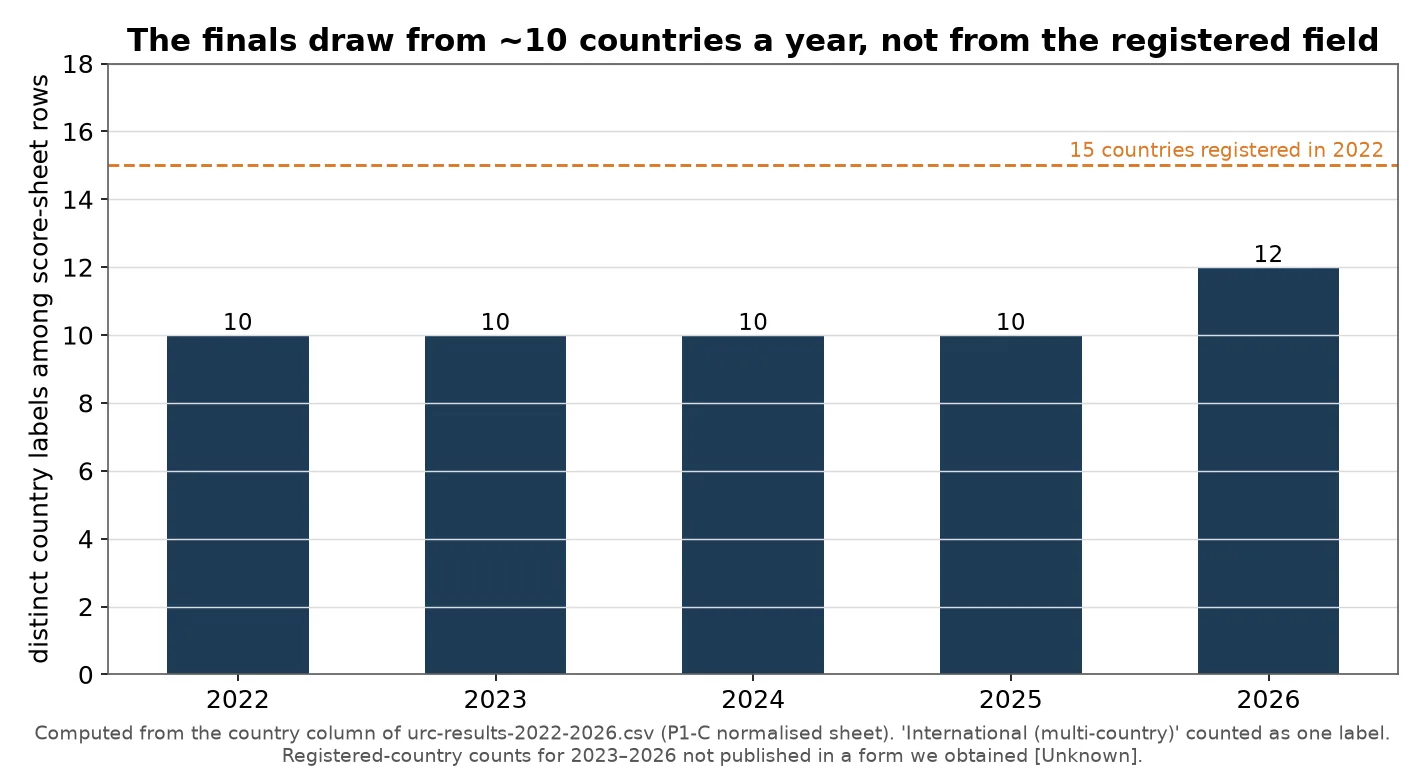
The interactive view counts finals team-years by country, so it measures depth rather than distinct labels: the United States contributes 70 of the 162 team-years, Poland 16 and Canada 17.
| Country | Teams in finals | Finals appearances | Best rank | Podiums | Mean total |
|---|---|---|---|---|---|
| United States | 21 | 70 | 1 | 10 | 264.4 |
| Poland | 7 | 16 | 1 | 1 | 266.3 |
| Canada | 6 | 17 | 7 | 0 | 233.9 |
| Bangladesh | 6 | 15 | 3 | 1 | 262.4 |
| India | 6 | 8 | 18 | 0 | 186.2 |
| Turkey | 4 | 10 | 15 | 0 | 190.3 |
| International | 2 | 6 | 8 | 0 | 210.4 |
| Mexico | 2 | 7 | 10 | 0 | 196.3 |
| Colombia | 2 | 3 | 21 | 0 | 191.5 |
| South Korea | 2 | 2 | 22 | 0 | 199.6 |
| Australia | 1 | 5 | 2 | 3 | 343.1 |
| Czechia | 1 | 1 | 18 | 0 | 235.7 |
| Japan | 1 | 1 | 35 | 0 | 126.6 |
| Italy | 1 | 1 | 36 | 0 | 125.1 |
The depth is American, but the top is not. The United States supplies 21 of 62 scoring teams and 10 of the 15 podium finishes, yet its mean total of 264.4 is below Poland’s 266.3 and only just above Bangladesh’s 262.4 S-URC-RESULTS. Australia is a one-team country whose team is elite: Monash has five finals, three podiums and the highest per-team mean in the data at 343.1.
Tiers and profiles
The census tiers every team from official scores and a documentation check, never from reputation: Tier A for a podium or a top-six average or an exceptionally documented top-six team, Tier B for a consistent top-20 record or a strong single year or a documented programme with finals history, Tier C for the remainder S-CENSUS.
| Tier | Teams | With a profile page | What the tier means |
|---|---|---|---|
| A | 8 | 8 | Podium in 2022–2026, or a top-six average, or exceptional documentation |
| B | 24 | 24 | Consistent top-20, strong single year, or documented with finals history |
| C | 36 | 19 | Remainder, including every team with review rows only |
The 17 Tier C teams without a profile are those that publish almost nothing; the census lists them and the absence is itself the finding. Tier A is Missouri S&T, West Virginia, Michigan, AGH, Monash, BYU, UIU and Northeastern.
The values on this page
| Statistic | Value | Definition | Period | Sample | Source | Chart and chapter |
|---|---|---|---|---|---|---|
| Teams in the census | 68 | Distinct teams in the score sheets | 2022–2026 | 187 rows | S-CENSUS | The 68-team census |
| Teams with a finals score | 62 | At least one row with mission scores | 2022–2026 | 187 rows | S-URC-RESULTS | Results explorer |
| Review-only rows | 25 | A review score and no finals result | 2022–2026 | 187 rows | S-URC-RESULTS | The 68-team census |
| Registrations | 99–116 | Teams listed by URC each year | 2022–2026 | Five team lists | S-URC22-TEAMS S-URC26-TEAMS | Review and judging |
| Finals field | 36–38 | Rows in each score sheet | 2022–2026 | Five score sheets | S-URC23-NEWS | Review and judging |
| Country labels | 15 | Distinct labels, including one multi-country entry | 2022–2026 | 187 rows | S-URC-RESULTS | Scores and results |
| Tier split | 8 / 24 / 36 | A, B and C counts | 2022–2026 | 68 teams | S-CENSUS | The 68-team census |
Evidence note
The 2023 sheet is the only year where the number of rows can be checked against an official finalist count, and the two agree at 37. For the other years, sheet membership is treated as finalist status by inference. The 25 review-only rows are excluded from every score statistic: they are evidence about selection, not about rover performance. Country means are unweighted across team-years and are not adjusted for field strength.
Sources for this page
- S-URC22-TEAMSURC2022 Team List ("URC2022 Featured 99 Teams, 15 Countries")Original
- S-URC26-TEAMSURC2026 Team ListOriginal Archived copy
- S-URC22-SCORESURC2022 Official ScoresOriginal
- S-URC23-SCORESURC2023 Official ScoresOriginal
- S-URC24-SCORESURC2024 Official ScoresOriginal
- S-URC25-SCORESURC2025 Official ScoresOriginal
- S-URC26-SCORESURC2026 Official ScoresOriginal Archived copy
- S-URC23-NEWSURC2023 News (champions, 37 finalists, expansion rationale)Original
- S-URC-RESULTSURC official scores 2022–2026, compiled CSVPrint copy
- S-CENSUSURC team census, master index (68 teams, 187 team-year rows, tiers, documentation test)Print copy