Scores and results
Final totals in the URC run from 125.14 to 469.57 and the middle of the field has barely moved in five years: the median finalist scored between 224.6 and 257.8 of 500 in every edition from 2022 to 2026. What changed is the shape of the distribution. The winner’s score rose 21 % while the last place fell 14 %, so the same 500-point scale now spreads teams further apart than it did in 2022. The sample is the 162 finals team-years in the five official score sheets.
Key takeaways
- A clean, reliable rover lands near the median. The median finalist has scored 224.6 to 257.8 of 500 for five straight years; that band is the realistic target for a first finished rover, not the podium.
- The ceiling rose and the floor fell. The winning total went from 388.97 in 2022 to 469.57 in 2026 while the last place went from 146.03 to 125.14. The 2026 field is the most stretched of the five, with a standard deviation of 84.6.
- The winner won on completion. Missouri S&T took the field maximum in Delivery at 100 and in Equipment Servicing at 100, matched the field maximum of 86 in Autonomy, and conceded 7 points on Science.
- Equipment Servicing predicts rank best. Its pooled rank correlation is 0.77 and its yearly value never fell below 0.75, ahead of Autonomy at 0.75 and Delivery at 0.68.
Levels and spread by year
| Year | Finalists | Mean | Median | SD | Minimum | Maximum | Range |
|---|---|---|---|---|---|---|---|
| 2022 | 26 | 240.3 | 233.6 | 71.6 | 146.0 | 389.0 | 243.0 |
| 2023 | 31 | 239.4 | 253.0 | 73.9 | 128.1 | 425.4 | 297.3 |
| 2024 | 34 | 242.8 | 246.8 | 65.1 | 135.4 | 392.8 | 257.4 |
| 2025 | 35 | 263.4 | 257.8 | 65.6 | 147.5 | 412.3 | 264.8 |
| 2026 | 36 | 242.9 | 224.6 | 84.6 | 125.1 | 469.6 | 344.5 |
All values are for teams with a finals score, from the five official sheets S-URC22-SCORES S-URC23-SCORES S-URC24-SCORES S-URC25-SCORES S-URC26-SCORES. The maximum possible total is 500 in every year.
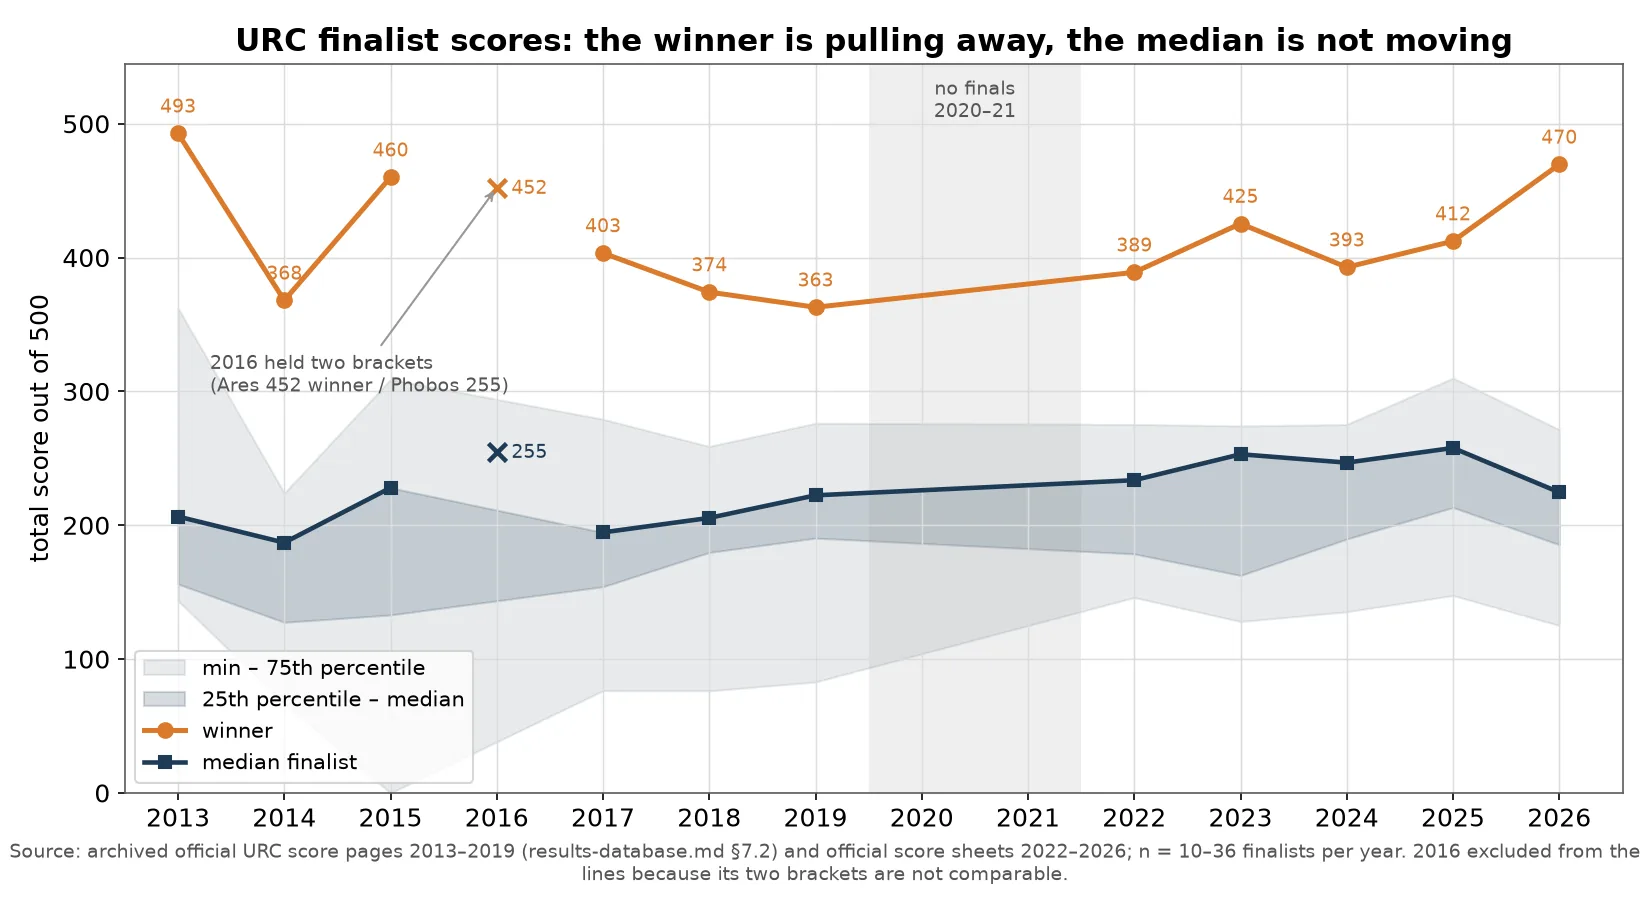
The interactive chart uses the 2022–2026 sheets, where every year has the same four missions and the same review. It plots the winner, the median and the quartiles on one scale, which is the same set of values as the table above.
What the distribution says
- The middle is a plateau, not a trend. Mean totals moved between 239.4 and 263.4 across five years, and the 2025 rise to 263.4 was followed by a fall back to 242.9. A median around 240 is the normal state of the field.
- The ceiling is a different series. The winning total rose from 388.97 to 469.57, a 21 % increase, and 2026 was the first year above 450. The previous best was 425.35 by West Virginia in 2023 S-URC23-SCORES.
- The floor fell with it. Last place went from 146.03 to 125.14, a 14 % drop, so the 2026 ratio of maximum to mean reached 1.93, the highest of the five years.
- The 2026 winner’s mission profile is the clearest single result in the data. Missouri S&T scored 90.57 in the review, 93 in Science, 100 in Delivery, 100 in Equipment Servicing and 86 in Autonomy, for 469.57 S-URC26-SCORES. The Science gap of 7 points to Monash’s 100 was the only mission where it was not at the top of the field.
Which mission predicts final rank
Spearman correlation between each component and final rank, where a positive value means a higher score goes with a better place.
| Year | Review | Science | Delivery | Equipment | Autonomy |
|---|---|---|---|---|---|
| 2022 | 0.56 | 0.70 | 0.77 | 0.83 | 0.84 |
| 2023 | 0.65 | 0.74 | 0.77 | 0.87 | 0.81 |
| 2024 | 0.60 | 0.44 | 0.71 | 0.83 | 0.77 |
| 2025 | 0.34 | 0.68 | 0.87 | 0.75 | 0.76 |
| 2026 | 0.36 | 0.77 | 0.78 | 0.79 | 0.78 |
| Pooled | 0.48 | 0.64 | 0.68 | 0.77 | 0.75 |
Equipment Servicing is the most reliable predictor in every year, because it rewards a complete, working manipulator rather than a lucky run. The review is the weakest: the ten best review scores and the ten best totals share only 5 or 6 teams in every year S-URC-RESULTS.
Dispersion tells the same story in a different way. The coefficient of variation of the review is 0.03–0.07, while Delivery runs 0.67–1.12, Equipment Servicing 0.69–0.90 and Autonomy 0.76–1.15. A compressed component cannot separate teams; the mission zeros discussed on the next page are where the separation happens.
The values on this page
| Statistic | Value | Definition | Period | Sample | Source | Chart and chapter |
|---|---|---|---|---|---|---|
| Winning total | 388.97–469.57 | Highest final total of the year | 2022–2026 | 162 team-years | S-URC-RESULTS | Results explorer |
| Median finalist | 224.6–257.8 | Middle team of the finals field | 2022–2026 | 162 team-years | S-URC-RESULTS | Chart above; Results explorer |
| Standard deviation | 65.1–84.6 | Spread of the year’s totals | 2022–2026 | 162 team-years | S-URC-RESULTS | Results explorer |
| Maximum to mean | 1.57–1.93 | How stretched the year is | 2022–2026 | 162 team-years | S-URC-RESULTS | Top versus rest |
| Rank correlation | 0.48–0.77 | Spearman, component against rank | 2022–2026 | 162 team-years | S-URC-RESULTS | Top versus rest |
| Best single total | 469.57 | Missouri S&T, 2026 | 2026 | 36 teams | S-URC26-SCORES | Missouri S&T |
Evidence note
Every value on this page comes from the five official score sheets and covers teams that recorded mission scores. A row with a review score and no mission score is not a finals result and is excluded. Rank correlations use Spearman’s coefficient on the finals field of each year, so they measure association with final position and not the cause of it. A correlation of 0.77 does not mean that Equipment Servicing alone produces a good rank.
Sources for this page
- S-URC22-SCORESURC2022 Official ScoresOriginal
- S-URC23-SCORESURC2023 Official ScoresOriginal
- S-URC24-SCORESURC2024 Official ScoresOriginal
- S-URC25-SCORESURC2025 Official ScoresOriginal
- S-URC26-SCORESURC2026 Official ScoresOriginal Archived copy
- S-URC-RESULTSURC official scores 2022–2026, compiled CSVPrint copy