Results explorer, 2022-2026
The five official score sheets hold 187 rows: 162 finals results and 25 lines with a SAR score and no mission score. Taken together, they answer two different questions, one about rover performance and one about the whole field that reached a sheet. This page explains what each row contains, what a zero does and does not mean, and what the explorer adds to a plain table.
Key takeaways
- Every row is a team-season. The total is the SAR plus four mission scores, each out of 100, minus any penalty S-URC27-RULES §1.a.i.
- A zero is a recorded mission score. A SAR-only row has no mission score at all, and an absent team has no row. The three cases are not the same.
- The finalist median has stayed between 224.6 and 257.8 of 500 for five seasons, while the winner rose from 388.97 to 469.57.
- Autonomy produced 67 zeros in 162 team-years. That single base rate does more to explain the ranking than any other number on this page.
How to read a score row
Each row carries a season, a team, a country, a tier, five component scores, a total and a rank. The 2026 winning row shows the structure:
| Field | Meaning | 2026 example |
|---|---|---|
| Season | Year of the score sheet | 2026 |
| Team | Canonical name after merging spelling variants | Missouri S&T Mars Rover Design Team |
| Country | Country listed for that team that season | United States |
| Tier | Census tier, from results and documentation | A |
| SAR | Written review, 100 points | 90.57 |
| Science | Science mission, 100 points | 93 |
| Delivery | Delivery mission, 100 points | 100 |
| Equipment | Equipment Servicing mission, 100 points | 100 |
| Autonomy | Autonomous Navigation mission, 100 points | 86 |
| Total | SAR plus the four missions, minus penalties, 500 points | 469.57 |
| Rank | Position by total among teams with mission scores | 1 |
The exemplar row is the 2026 winner, from the official score sheet S-URC26-SCORES.
The arithmetic is the check to run on any row: 90.57 + 93 + 100 + 100 + 86 = 469.57. A penalty appears in only one row across the five seasons, and the total subtracts it: Mars Rover UdeG Space scored 163.91 across the five components in 2025 and recorded 147.52 after a 16.39 penalty S-CENSUS.
Mission names change without changing the column. The second mission is Extreme Retrieval and Delivery in 2022, Extreme Delivery in 2023 and 2024, and Delivery from 2025, at the same position and on the same 100-point scale. The column is positional, so pooling the five seasons does not mix different tasks S-CENSUS.
What the rank column is
No score sheet has a rank column. Each sheet prints teams in descending total, followed by teams holding only a SAR score, and the rank in the data is the row order among teams with mission scores. It is an inference from the official ordering, not a published field, and it is the one number on the page that a published rank column would replace S-CENSUS.
A zero is not a non-entry
Three different situations look similar in a sorted table and mean very different things.
A recorded zero. The team attended the mission and scored nothing on it. In 2026, 12 of the 36 teams with a finals result recorded a zero on Delivery, 5 on Equipment Servicing and 16 on Autonomy S-URC26-SCORES.
A SAR-only row. The team has a SAR score and no mission score. The SAR column is filled, and the four mission columns, the total and the rank are empty. Twenty-five rows across the five seasons are in this state S-CENSUS.
An absent team. The team registered and has no row at all. Fifty-four teams appear on two or more official team lists and in no score sheet from 2022 to 2026 S-CENSUS.
The distinction matters because a SAR-only row can hide a strong team. MIST Mongol Barota scored 92.85 on the 2022 SAR, which would have been the third-best SAR among the 26 finalists, and left no finals result that year S-URC22-SCORES. AGH Space Systems won in 2024 and then recorded an 88.61 SAR in 2025 with no finals result at all S-URC25-SCORES. A missing season is a missing season, not a decline.
The explorer
The explorer reads the same 187 rows. It filters by season, country and tier, searches team, university and country, and shows the five component scores beside the total and rank. A team with a profile links through to it; a team without one stays as plain text. The fallback for a browser without JavaScript is a download of the table as CSV.
Scores by season
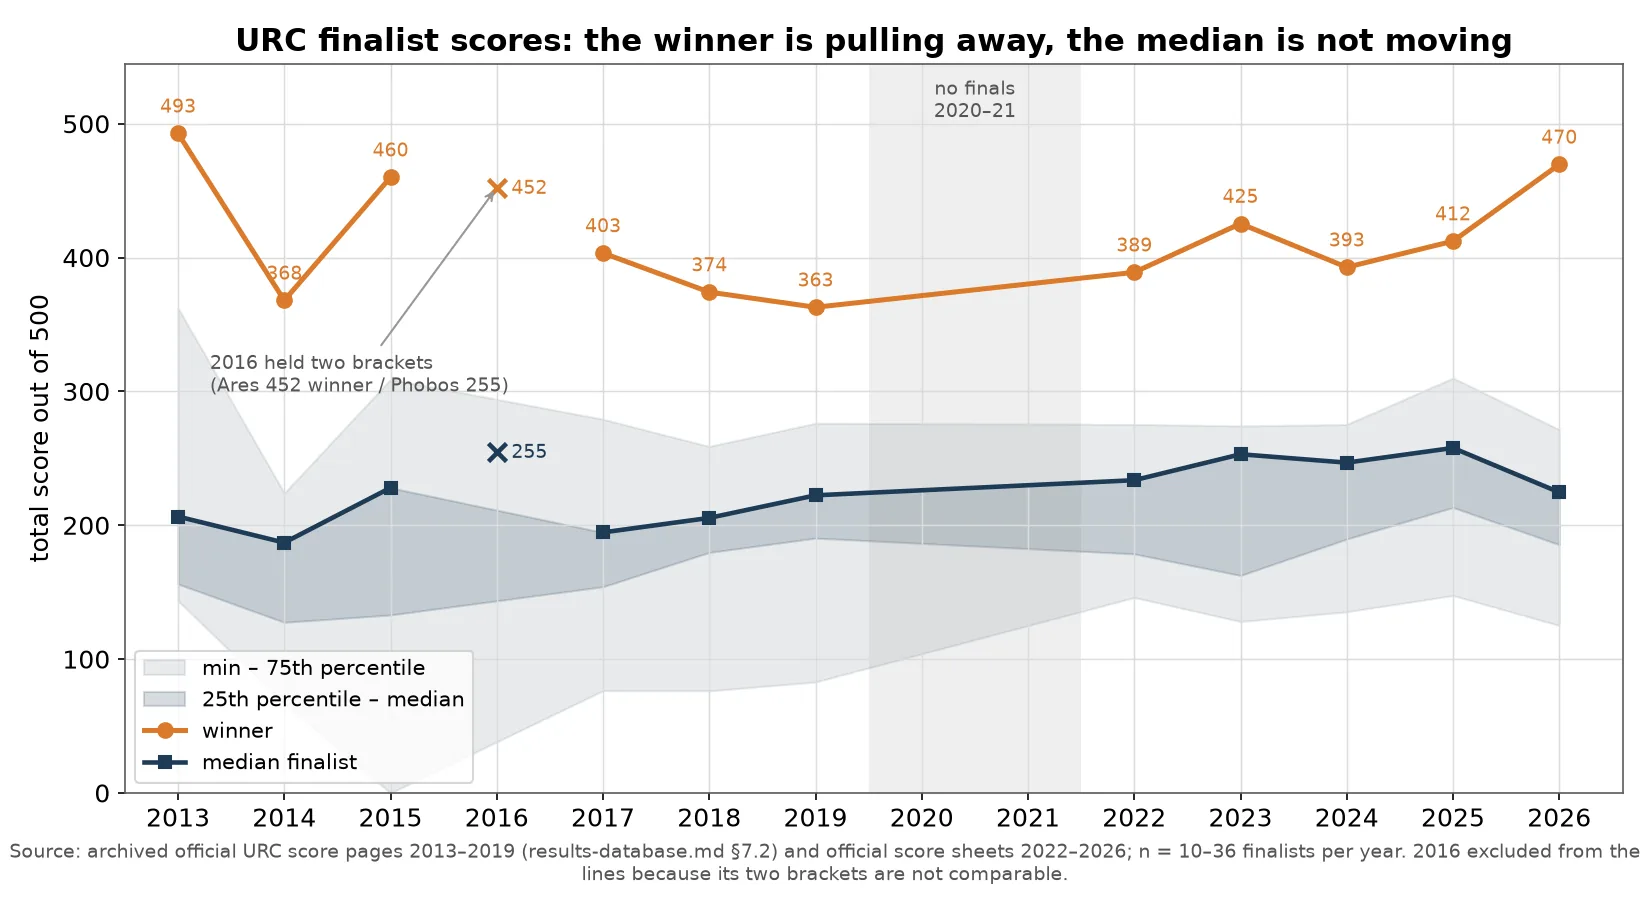
The interactive chart repeats the same measures for 2022–2026 only, which is the sample used throughout this page. Both forms show the same two facts. The median finalist stays inside a narrow band for five seasons while the winner moves away from it. The gap between the winner and the median reached 245 points in 2026, about two and a half missions’ worth of points.
What the finalists scored
Finalists only: teams that recorded a mission score.
| Season | Teams | Mean | Median | Standard deviation | Lowest | Highest |
|---|---|---|---|---|---|---|
| 2022 | 26 | 240.3 | 233.6 | 71.6 | 146.0 | 389.0 |
| 2023 | 31 | 239.4 | 253.0 | 73.9 | 128.1 | 425.4 |
| 2024 | 34 | 242.8 | 246.8 | 65.1 | 135.4 | 392.8 |
| 2025 | 35 | 263.4 | 257.8 | 65.6 | 147.5 | 412.3 |
| 2026 | 36 | 242.9 | 224.6 | 84.6 | 125.1 | 469.6 |
Totals from the official score sheets, finalists only S-URC22-SCORES S-URC23-SCORES S-URC24-SCORES S-URC25-SCORES S-URC26-SCORES.
The middle of the field is the most useful benchmark a first-time team has. A rover that finishes all four missions at a moderate level lands near 230 to 260 points, close to the median of every season, and the median has not moved in five years. The 2026 season is the most stretched of the five: the lowest finalist dropped to 125.1 while the winner reached 469.6, a range of 344.5 points.
Counting every row instead of finalists only changes the picture, and the difference is worth knowing because both versions are quoted in public summaries:
| Season | Rows | All-row mean | All-row median | Lowest row |
|---|---|---|---|---|
| 2022 | 36 | 197.8 | 181.3 | 80.2 |
| 2023 | 37 | 215.0 | 229.4 | 85.1 |
| 2024 | 38 | 226.6 | 231.2 | 84.6 |
| 2025 | 38 | 249.7 | 243.4 | 88.6 |
| 2026 | 38 | 234.7 | 215.1 | 84.7 |
The same sheets with SAR-only rows included, reading a SAR-only row’s total as its SAR score. The all-row mean sits 8 to 42 points below the finalist mean, and the gap tracks the number of SAR-only rows, which fell from ten in 2022 to two in 2026 S-URC22-SCORES S-URC26-SCORES.
The finalist sample describes rover performance on the field. The all-row sample describes the whole set of teams that reached a sheet, including the ones that never drove. A statement about the level of the competition needs the first; a statement about the size of the funnel needs the second.
Where the zeros fall
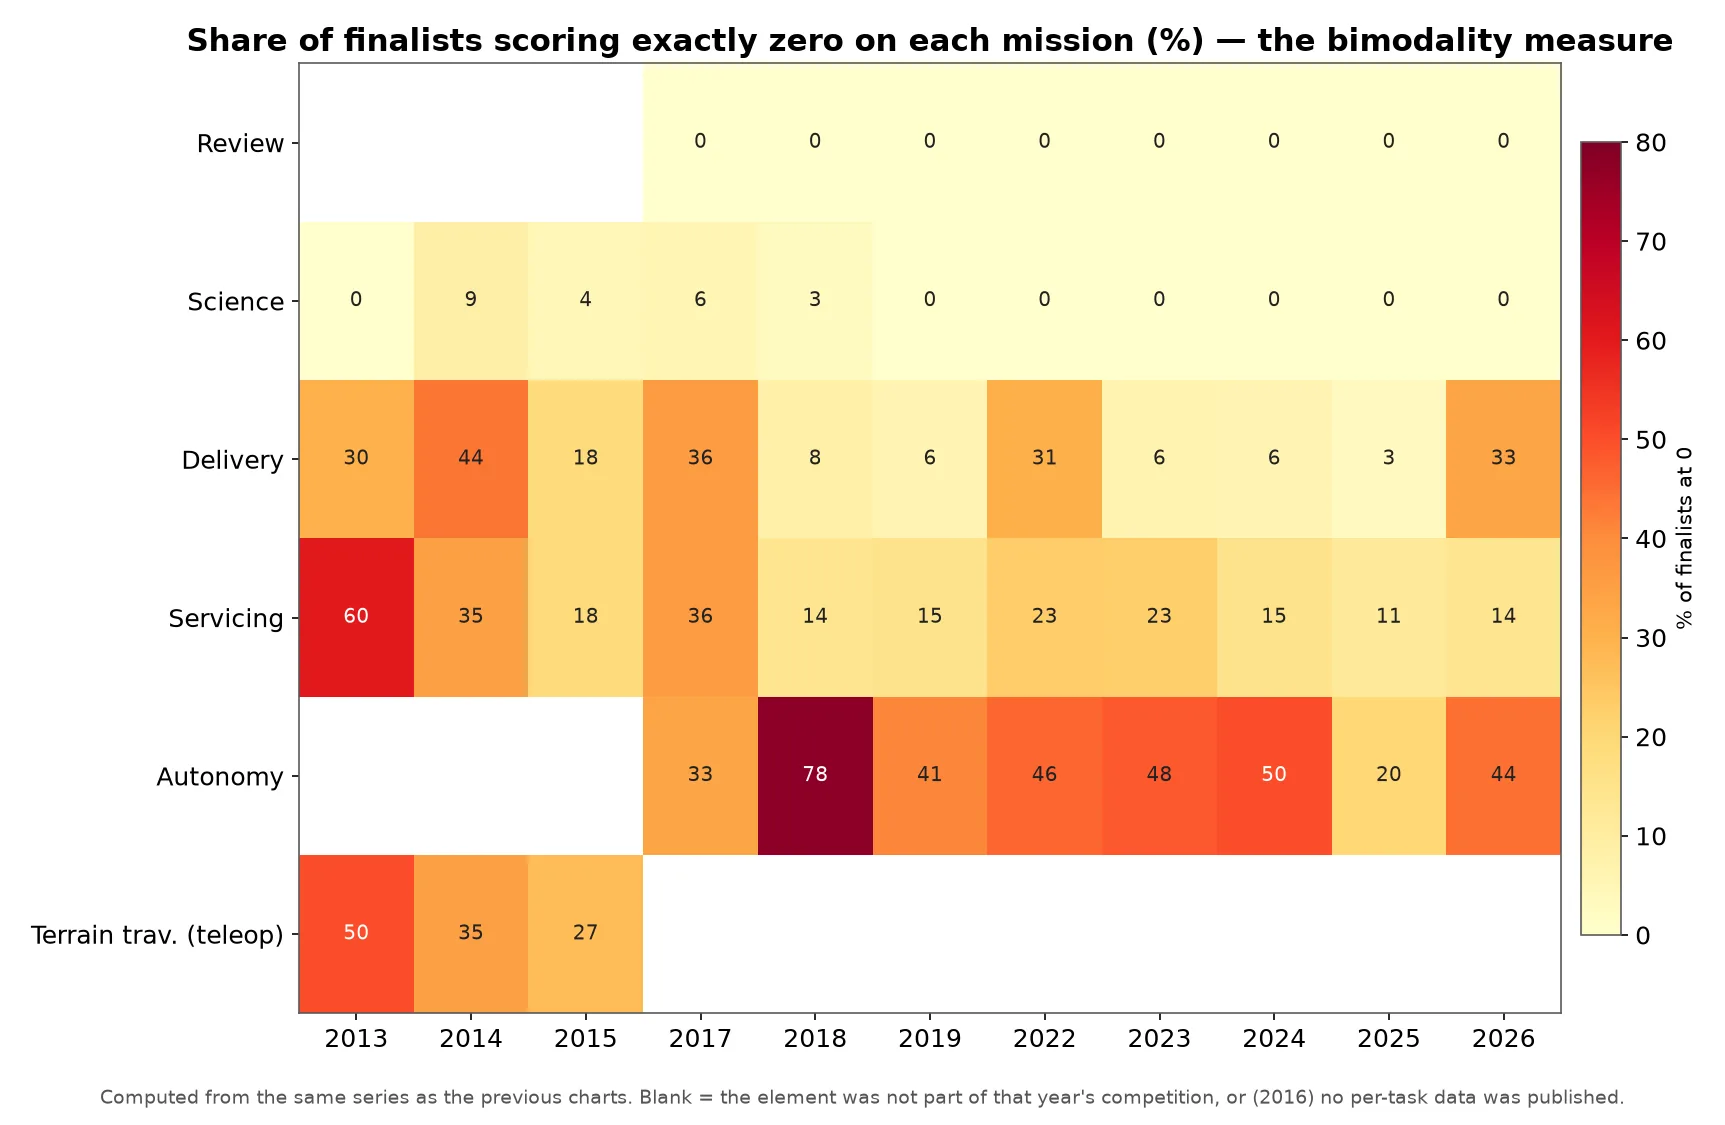
Across the 162 finals team-years, Science recorded no zeros, Delivery 25, Equipment Servicing 27 and Autonomy 67, a base rate of 41 % S-URC22-SCORES S-URC26-SCORES. Autonomy participation is not improving in a straight line: 2025 was an outlier with 7 zeros in 35 starts, and 2026 returned to 16 zeros in 36 starts.
The pattern behind those numbers is bimodal, not gradual. A team either scores well on a field mission or scores nothing, because the failure that produces a zero is usually a rover that cannot start the mission rather than a run that earns a few points. That is the statistical case for spending the first months of a build on a rover that drives, sees and communicates, before adding capability.
A rank is a weekend, not a trend
Year-to-year rank moves far more than the design quality behind it. ARES Project went 32nd, 30th and 8th in three appearances; UdeG Space went 34th, 35th and 14th; Sooner Rover Team went 7th, 12th, 19th and 32nd; Quantum Robotics went 15th, 10th, 31st and 23rd S-URC22-SCORES S-URC26-SCORES. Each of those swings is a subsystem that worked, or did not, on one weekend.
Some programmes are steady. Project Scorpio’s three appearances are 14th, 14th and 13th, a standard deviation of 0.5 rank places; Missouri S&T’s five are 3rd, 6th, 4th, 1st and 1st, for 1.9; KARURA, Toronto MetRobotics and Binghamton sit between 1.9 and 2.1. Steadiness of that kind comes from breadth across missions rather than from a single strong subsystem.
The clearest sustained climbs are also visible in the same data. UIU Mars Rover went 13th, 9th, 5th, 6th and 3rd; Northeastern went 16th, 13th, 10th, 3rd and 6th; WVU went 10th, 1st, 2nd, 2nd and 4th S-URC22-SCORES S-URC26-SCORES. Three years is a better unit of comparison than one.
What the scores cannot show
- Why a mission failed. A zero does not record whether the rover attempted and failed, did not attempt, or withdrew. Any causal account needs a report, a video or a news item.
- Who was invited. The sheet is not the registration list, and the 25 SAR-only rows are read here as finalists without a finals result, on the strength of one season where the row count matched the announced finalist count S-URC23-NEWS.
- Whether 2026 is a trend. The 2026 standard deviation rose 29 % over 2025, from 65.6 to 84.6, and the winning total rose 14 %, from 412.27 to 469.57. One season is not a trend, and the 2027 mission set differs from all five of these.
- The effect of a rule change. These are descriptive statistics. The 2027 competition renames Science as Astrobiology, adds a two-capability science rule and raises the autonomy requirement, so the shares above are a reference point for comparison rather than a forecast.
Where to go next
- The 68-team census holds the team-level version of the same data.
- Team browser turns the rows into cards with profiles attached.
- The URC landscape reads the same numbers as a strategy.
- What separates the top from the rest carries the full variance and zero analysis.
- Zeros and consistency collects the zero statistics on one page.
Sources for this page
- S-URC27-RULESUniversity Rover Challenge 2027 – Requirements and GuidelinesOriginal Archived copy
- S-URC26-SCORESURC2026 Official ScoresOriginal Archived copy
- S-CENSUSURC team census, master index (68 teams, 187 team-year rows, tiers, documentation test)Print copy
- S-URC22-SCORESURC2022 Official ScoresOriginal
- S-URC25-SCORESURC2025 Official ScoresOriginal
- S-URC23-SCORESURC2023 Official ScoresOriginal
- S-URC24-SCORESURC2024 Official ScoresOriginal
- S-URC23-NEWSURC2023 News (champions, 37 finalists, expansion rationale)Original