The URC landscape
Sixty-eight teams appear in the official URC score sheets from 2022 to 2026, and roughly one in three registered teams reaches the field. Five seasons of results describe a field that is stable in the middle and fragile at the edges: the median finalist scored between 224.6 and 257.8 of 500 in every season, while a handful of missions produced almost all of the zeros. The pages that follow carry the census, the results explorer, the team browser and the study of sister competitions; this page connects them.
Key takeaways
- About one in three applicants reaches the field. Registrations ran from 99 in 2022 to 116 in 2026, while the finals field stayed at 36 to 38 teams S-URC22-TEAMS S-URC26-TEAMS.
- Completion beats optimisation. Science produced no zero scores in five seasons; Autonomy produced 67 zeros in 162 team-years, a 41 % base rate S-URC22-SCORES S-URC26-SCORES.
- The written review gates the field and does not rank it. The SAR explains 2.8 % of the variance in final totals; Autonomy explains 30.6 % S-URC22-SCORES S-URC26-SCORES.
- The middle of the field has not moved. The median finalist scored between 224.6 and 257.8 of 500 in every season, while the winner rose from 388.97 to 469.57 S-URC22-SCORES S-URC26-SCORES.
The field in one table
Five seasons, five official score sheets. The registration counts come from the URC team lists of each year; the field counts come from the score sheets themselves.
| Season | Teams registered | Rows in the sheet | Rows with a mission score | Countries represented | Winner and total |
|---|---|---|---|---|---|
| 2022 | 99 | 36 | 26 | 15 | Michigan MRover, 388.97 |
| 2023 | 104 | 37 | 31 | 17 | WVU Team Mountaineers, 425.35 |
| 2024 | 102 | 38 | 34 | 18 | AGH Space Systems, 392.76 |
| 2025 | 114 | 38 | 35 | 18 | Missouri S&T, 412.27 |
| 2026 | 116 | 38 | 36 | 18 | Missouri S&T, 469.57 |
Registration counts come from the season team lists S-URC22-TEAMS S-URC23-TEAMS S-URC24-TEAMS S-URC25-TEAMS S-URC26-TEAMS; field counts and winners from the official score sheets S-URC22-SCORES S-URC23-SCORES S-URC24-SCORES S-URC25-SCORES S-URC26-SCORES. The 2026 country count includes two multi-national entries.
One in three reaches the field
The score sheet is not the registration list. Registered teams clear the System Acceptance Review to be invited to the 36-team field, and the 2023 sheet has exactly 37 rows, the announced finalist count for that year, which supports reading a score-sheet row as finalist status S-URC23-NEWS. For the other four seasons the published sheet is the only record of who competed.
Two facts follow from that reading. Roughly two-thirds of registrants never reach Utah, so the SAR is the competition’s first cut rather than a formality S-URC27-RULES §3.a.iii. A missing season is also not evidence of a worse rover: AGH Space Systems won in 2024 and recorded a SAR score with no finals result in 2025 S-URC25-SCORES.
Twenty-five of the 187 rows across the five seasons carry a SAR score and no mission score at all. Those teams cleared at least part of the desk and left no finals record; the census page lists them with their SAR scores.
Where the teams come from
The American block dominates by headcount. Of the 116 teams registered for 2026, 60 came from the United States, followed by India (11), Bangladesh (9), Canada (9), Türkiye (6), Poland (5) and Japan (3), with two each from Colombia, México and Korea, and single entries from Australia, Czechia, Italy, Perú, Puerto Rico, Singapore and one Japan/US joint team S-URC26-TEAMS.
Depth and quality are not the same thing. The United States supplies 21 of the 68 census teams and 70 of the 162 finals team-years, yet its mean total is close to Poland’s and Poland’s mean final rank is better S-CENSUS S-URC26-SCORES. Australia is a single team, Monash Nova Rover, and that team carries the highest mean total in the dataset at 343.1.
Fifteen country labels appear across the five score sheets and 14 of them in a finals field; Egypt’s Pharaohs Team carries SAR-only rows and never converted one into a finals result S-CENSUS.
How performance is distributed
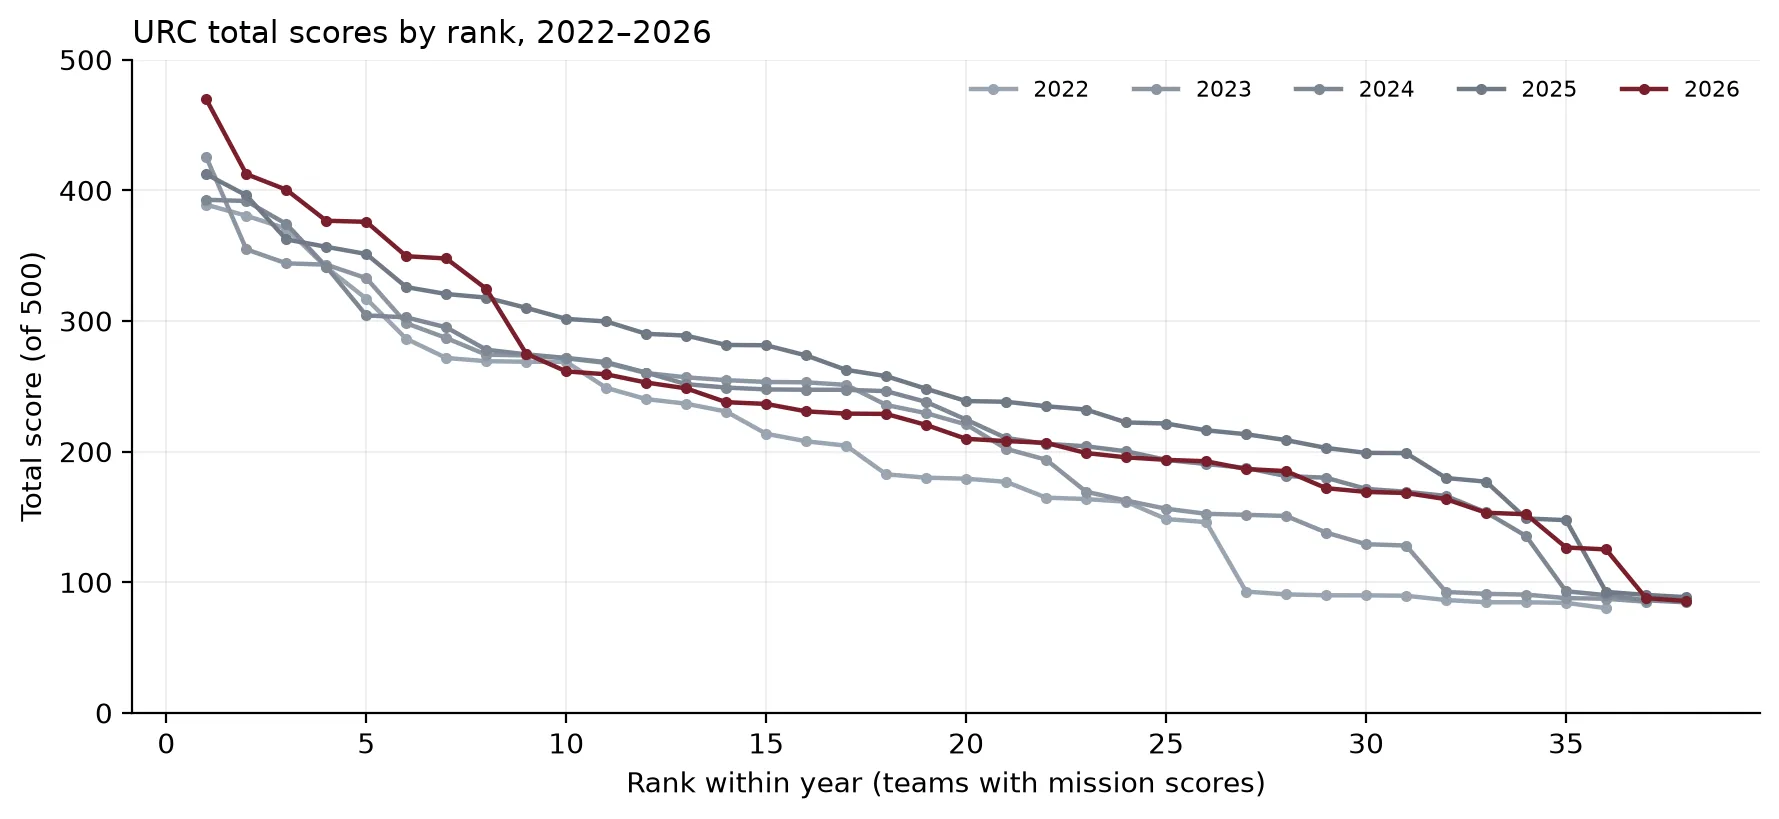
The two halves of the distribution behaved differently. The median finalist scored between 224.6 and 257.8 points for five straight seasons; a clean, reliable rover that finishes all four missions lands near that band. The winner’s total rose 21 % over the same period, from 388.97 in 2022 to 469.57 in 2026, and 2026 was the first season in which any team passed 450 S-URC22-SCORES S-URC26-SCORES.
| Season | Science mean (zeros) | Delivery mean (zeros) | Equipment mean (zeros) | Autonomy mean (zeros) |
|---|---|---|---|---|
| 2022 | 81.3 (0) | 25.1 (8) | 21.8 (6) | 23.9 (12) |
| 2023 | 72.3 (0) | 15.9 (2) | 35.3 (7) | 26.4 (15) |
| 2024 | 73.5 (0) | 22.9 (2) | 32.0 (5) | 23.9 (17) |
| 2025 | 79.6 (0) | 30.9 (1) | 31.5 (4) | 31.5 (7) |
| 2026 | 78.5 (0) | 22.9 (12) | 29.1 (5) | 26.7 (16) |
Mission means and zero counts for teams that recorded a mission score S-URC22-SCORES S-URC26-SCORES. Denominators vary by season because not every finalist records every mission.
Three patterns hold in every season:
- Science is the reliable points. No team scored zero on Science in five years, the mean is the highest of the four, and the spread is the narrowest. A competent, well-documented science effort returns 70 to 90 points almost regardless of how the rover drives.
- Autonomy and Delivery are where the field fractures. Across the 162 finals team-years, Autonomy recorded 67 zeros and Delivery 25, against none in Science S-URC22-SCORES S-URC26-SCORES.
- Equipment Servicing rewards a complete manipulator. Its mean stays in the low 30s with a standard deviation almost as large, and 4 to 7 zeros a season.
The variance decomposition is the sharpest statement of the same result. Because the total is the sum of five components, the share of total variance each component explains can be computed directly over the 162 finals team-years:
| Component | Share of finals-total variance |
|---|---|
| Autonomy | 30.6 % |
| Equipment Servicing | 27.7 % |
| Delivery | 24.3 % |
| Science | 14.4 % |
| SAR | 2.8 % |
Computed as the covariance of each component with the final total, divided by the variance of the total, pooled over 2022–2026 S-URC22-SCORES S-URC26-SCORES. The decomposition covers finalists only, every one of whom has already passed the SAR.
The written review has never explained more than about 6 % of the spread of final scores in any era: the CDR explained 1.9 % in 2017 and the SAR 5.7 % in 2018, 3.3 % in 2019 and 2.8 % pooled across 2022–2026 S-URC17-SCORES S-URC18-SCORES S-URC19-SCORES S-URC22-SCORES. The rank correlation tells the same story. The pooled Spearman correlation between SAR score and final rank is 0.48, falling to 0.34 and 0.36 in 2025 and 2026, and the top ten by SAR overlaps the top ten by total by only five or six teams each year. The desk gates the field; the field ranks it.
The teams to study first
Tier A holds the eight programmes that reached a podium or combined a top-eight finish with full public documentation. The mean total covers finals seasons only.
| Team | Country | Best rank | Mean total 2022–26 | What sets it apart |
|---|---|---|---|---|
| Missouri S&T | United States | 1 | 378.5 | Champion in 2025 and 2026; the most complete recent documentation |
| WVU Team Mountaineers | United States | 1 | 371.7 | 2023 champion; top four in four of five seasons |
| Michigan MRover | United States | 1 | 336.4 | 2022 champion; INCOSE systems-engineering award in 2026 |
| AGH Space Systems | Poland | 1 | 336.0 | 2024 champion; the strongest single-season peaks |
| Monash Nova Rover | Australia | 2 | 343.1 | 2026 runner-up; open-source software stack |
| BYU Mars Rover | United States | 3 | 318.4 | Third or fourth in 2023–2025, then thirteenth in 2026 |
| UIU Mars Rover | Bangladesh | 3 | 308.2 | 2026 third; the strongest sustained climb in the field |
| Northeastern | United States | 3 | 289.7 | 2025 third; deep autonomy work |
Best rank and mean total from the census, finals seasons only S-CENSUS. Tier labels are defined on the census page.
What the leading teams share
Five patterns recur across the Tier-A programmes. They are inferences from results structure, tested against the dossiers and the subsystem chapters rather than measured directly.
- They finish missions. Their score profiles carry few zeros, and the advantage comes from breadth across three or four missions rather than one spectacular run.
- They have working autonomy. Even a modest autonomy score earns 40 to 90 points, which the field’s zero-heavy distribution makes disproportionately valuable.
- Their science is systematic rather than clever. High Science scores follow documentation discipline and a repeatable analysis workflow, not an exotic instrument.
- They invest in communications as a subsystem. Poor comms is the most common reason a rover sits motionless, and it is the judges’ own headline advice.
- They come back. Seven of the eight recorded a finals score in all five seasons; AGH raced four editions and reached three finals S-CENSUS.
Strategic consequences for a first build
- Survival first. Two-thirds of registrants never reach the field, so the first goal is a SAR that ranks inside the top 36, which rewards demonstrated capability rather than CAD.
- Completion beats optimisation. A rover that finishes all four missions at half of the available points beats a rover that excels at one and fails two.
- Science is the safest 70 points; autonomy is the biggest differentiator. Engineering effort follows that split, and both rest on a rover that reliably drives, sees and communicates.
- The horizon is three years. The leading programmes are repeat competitors; a first-year team that qualifies and scores in the middle of the field has done well.
- Failures repay study as closely as wins. Most of the failure evidence in this reference comes from teams outside the top ten.
Where to go next
- The 68-team census carries the full team list, the tiering rule and the teams without a profile.
- Results explorer, 2022–2026 reads the score sheets row by row, including the difference between a zero and a non-entry.
- Team browser filters all 70 records by tier and country and links to each profile.
- Team dossiers holds the 51 team studies, grouped by tier.
- Sister competitions covers five other rover events and two NASA student events, and where their evidence misleads.
- What separates the top from the rest works the variance and zero analysis at length.
- The field in statistics collects the census and registration figures on one page.
Sources for this page
- S-URC22-TEAMSURC2022 Team List ("URC2022 Featured 99 Teams, 15 Countries")Original
- S-URC26-TEAMSURC2026 Team ListOriginal Archived copy
- S-URC22-SCORESURC2022 Official ScoresOriginal
- S-URC26-SCORESURC2026 Official ScoresOriginal Archived copy
- S-URC27-RULESUniversity Rover Challenge 2027 – Requirements and GuidelinesOriginal Archived copy
- S-URC23-TEAMSURC2023 Team ListOriginal
- S-URC24-TEAMSURC2024 Team ListOriginal
- S-URC25-TEAMSURC2025 Team ListOriginal
- S-URC23-SCORESURC2023 Official ScoresOriginal
- S-URC24-SCORESURC2024 Official ScoresOriginal
- S-URC25-SCORESURC2025 Official ScoresOriginal
- S-URC23-NEWSURC2023 News (champions, 37 finalists, expansion rationale)Original
- S-CENSUSURC team census, master index (68 teams, 187 team-year rows, tiers, documentation test)Print copy
- S-URC17-SCORESURC2017 Scores (CDR + 4 missions)Original
- S-URC18-SCORESURC2018 Scores (SAR + 4 missions)Original
- S-URC19-SCORESURC2019 Scores (SAR + 4 missions, alphabetical)Original