Statistics: the book in numbers
The numbers on this site rest on five official score sheets holding 187 team-year rows, 162 of them with finals scores, together with 17 rover mass configurations, 66 subsystem interfaces, 54 sourced failure entries and 118 mass and power table rows. Each value is stated once in its own right, with the period it covers and the sample it rests on. The eleven pages below take one subject each and show the arithmetic in front of the evidence. Nothing here is rounded up to a round number, and where a figure is a model output the caption says so.
Key takeaways
- Reliability is the largest single effect in the data. Team-years with no zero mission average rank 10.2; one zero moves that to 21.1 and costs about 85 points of total.
- Three hard missions decide the ranking. Autonomy explains 30.6 % of the variance in finals totals, Equipment Servicing 27.7 % and Delivery 24.3 %; the written review explains 2.8 %.
- The field is small and persistent. 68 teams, 36 finals places, 13 teams in all five editions and four different winners in five years.
- The rover class has converged. Four to six wheels, passive articulation, an arm, a camera mast and a laptop at the command station describe the top five and the bottom ten alike.
What the statistics cover
Every subpage states a value, a one-line definition, the period, the sample, the source and a link to the chapter that develops it. The evidence base is uniform: the official URC score sheets for 2022 to 2026 S-URC22-SCORES S-URC23-SCORES S-URC24-SCORES S-URC25-SCORES S-URC26-SCORES, the 2027 rules and their Q&A S-URC27-RULES S-URC27-QA, the 68-team census S-CENSUS and the mass and power data collected in the appendix. A figure that comes from a parameter model rather than from a measurement carries that label on the page that uses it.
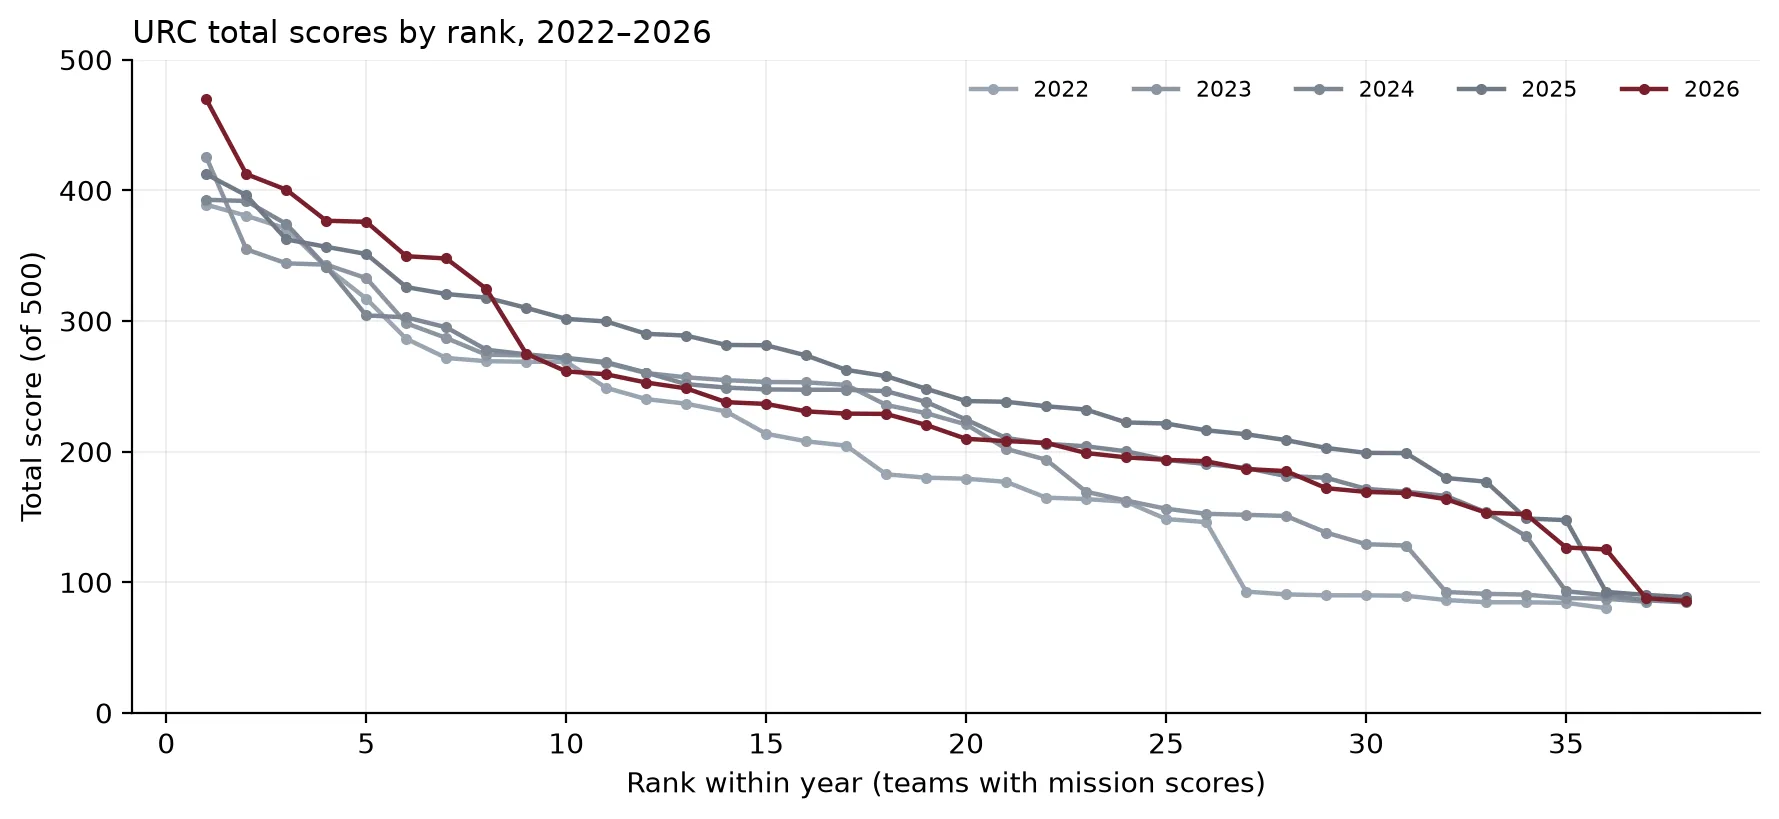
The interactive view plots the winner, the median and the quartile band by year from the same 162 team-years, so the shape of the field can be read year by year.
The pages
| Page | What it measures | Headline value | Period and sample |
|---|---|---|---|
| Competition structure | Points, penalties, mission clocks and deadlines | 500 points | 2027 rules |
| The field | Registrations, finals places, countries and tiers | 68 teams, 15 country labels | 2022–2026, 187 rows |
| Scores and results | Levels, spread and rank correlation | Median 224.6–257.8 | 162 finals team-years |
| Zeros and consistency | Exact zeros and what they cost | 41.4 % Autonomy zeros | 162 finals team-years |
| Top versus rest | What separates the elite | 175.9-point gap | 49 team-years in two sets |
| Mass | What rovers weigh | 47.9 kg mean | 17 configurations |
| Power and energy | Draw, energy and pack size | 249 W average, 3.7 kW peak | Model and 8 packs |
| Subsystem comparisons | Mass, power, interfaces and failures by subsystem | 66 interfaces | 12 subsystems |
| Failures and interfaces | How rovers fail and what couples | 54 entries, 37 high interfaces | 2017–2027 |
| Teams and hardware | Experience, countries and design convergence | 13 teams in all five editions | 68 teams |
| Key numbers | The canonical table on one page | All values | All periods |
The chart and table set
The interactive figures use the same two source records as the static charts: the 187-row results table and the 118-row mass and power table. The rest of the analysis is presented as tables, because most of these statistics are a handful of numbers with a long definition and a chart adds nothing.
| Figure | What it shows | Sample | Where it is discussed |
|---|---|---|---|
| Score distribution by rank | One curve per year | 162 finals team-years | Scores and results |
| Winner and median by year | The ceiling rises, the middle holds | 2013–2026 | Scores and results |
| Zero rate by mission | Exact zeros, year by year | 162 finals team-years | Zeros and consistency |
| Cost of a zero | Rank and total against the zero count | 162 finals team-years | Zeros and consistency |
| Variance shares | The five components of the total | 162 finals team-years | Top versus rest |
| Mission profiles | Top-5, bottom-10 and 2026 sets | 49 team-years | Top versus rest |
| Mass database | Every published mass against 50 kg | 17 configurations | Mass |
| Mass against score | The 12 team-years with both values | 12 team-years | Mass |
| Energy against time | Model demand and observed packs | Model, 8 packs | Power and energy |
| Interface network | 37 high-criticality interfaces | 12 subsystems | Failures and interfaces |
| Failure taxonomy | 54 entries by class and grade | 54 entries | Failures and interfaces |
| Consistency by team | Mean total against year-to-year SD | 28 teams | Teams and hardware |
Evidence note
162 team-years carry a finals score. A further 25 rows carry a review score and no finals result, and they are excluded from every mean and rank statistic on these pages. Mission zeros are exact zeros in the official sheets, which do not distinguish an attempted failure from a withdrawal. Model outputs, notably the mass fractions and the power and energy values, are labelled as models wherever they appear.
Sources for this page
- S-URC22-SCORESURC2022 Official ScoresOriginal
- S-URC23-SCORESURC2023 Official ScoresOriginal
- S-URC24-SCORESURC2024 Official ScoresOriginal
- S-URC25-SCORESURC2025 Official ScoresOriginal
- S-URC26-SCORESURC2026 Official ScoresOriginal Archived copy
- S-URC27-RULESUniversity Rover Challenge 2027 – Requirements and GuidelinesOriginal Archived copy
- S-URC27-QAURC2027 Questions & Answers (updated through 2026-10-11)Original Archived copy
- S-CENSUSURC team census, master index (68 teams, 187 team-year rows, tiers, documentation test)Print copy