Top versus rest
The top five teams by mean total and the bottom ten build the same class of machine: four or six wheels, passive articulation, an arm, a camera mast and a laptop at the command station. What separates them is completion. The two sets differ by 5.2 points in the review and by 44 to 56 points in each of the three hard missions, and the gap in total is 175.9 points. This page compares the two sets, using 23 team-years for the top five and 26 for the bottom ten from the 2022–2026 score sheets.
Key takeaways
- The gap is in the hard missions, not the review. Top five against bottom ten: review +5.2, Science +20.8, Delivery +44.4, Equipment Servicing +49.2, Autonomy +55.7.
- The three hard missions explain 82.6 % of the variance. Autonomy 30.6 %, Equipment 27.7 % and Delivery 24.3 %, against 2.8 % for the review.
- The bottom ten is not uniformly worse. It is a normal Science team at 68.69 with almost no Equipment Servicing score at 9.84 and almost no Autonomy at 3.71.
- Completion beats optimisation. The 2026 top eight scored a non-zero on all 32 mission runs; 12 of the other 28 zeroed Delivery and 16 zeroed Autonomy.
The two comparison sets
All values are finals team-years, 2022–2026. A team-year enters the means only when it has a finals score; the 25 review-only rows are excluded.
| Set | Teams | Team-years | Mean total | Mean review | Mean rank |
|---|---|---|---|---|---|
| Top five by mean | 5 | 23 | 354.6 | 93.03 | 4.6 |
| Bottom ten by mean | 10 | 26 | 178.7 | 87.86 | 27.3 |
| Gap | +175.9 | +5.17 |
The top five are Missouri S&T, West Virginia, Monash, Michigan and AGH. The bottom ten are Binghamton, KARURA, RoSE, Husky, Cornell, UdeG, RoboJackets, Robocol, Space Concordia and Team Interplanetar. Teams with a single finals appearance are excluded from both sets, so a one-year cameo cannot define the bottom; 18 teams fall into that excluded group S-URC-RESULTS.
A second set checks the first. In 2026 the largest score gap is first to second, 57.16 points, and the second largest is eighth to ninth, 324.59 to 274.91, a 49.68-point step. The eight teams that cleared 300 points therefore form a natural group.
Variance shares
Because total equals the review plus the four missions minus penalties, the exact contribution of each component to the spread of totals is its covariance with the total, and the contributions add to the variance of the total.
| Component | Share of variance | Reading |
|---|---|---|
| Autonomy | 30.6 % | The largest single source of spread |
| Equipment Servicing | 27.7 % | Rewards a complete manipulator |
| Delivery | 24.3 % | The most volatile of the three |
| Science | 14.4 % | Everyone can score; it separates least |
| Review | 2.8 % | A gate, worth 20 % of the points and 2.8 % of the spread |
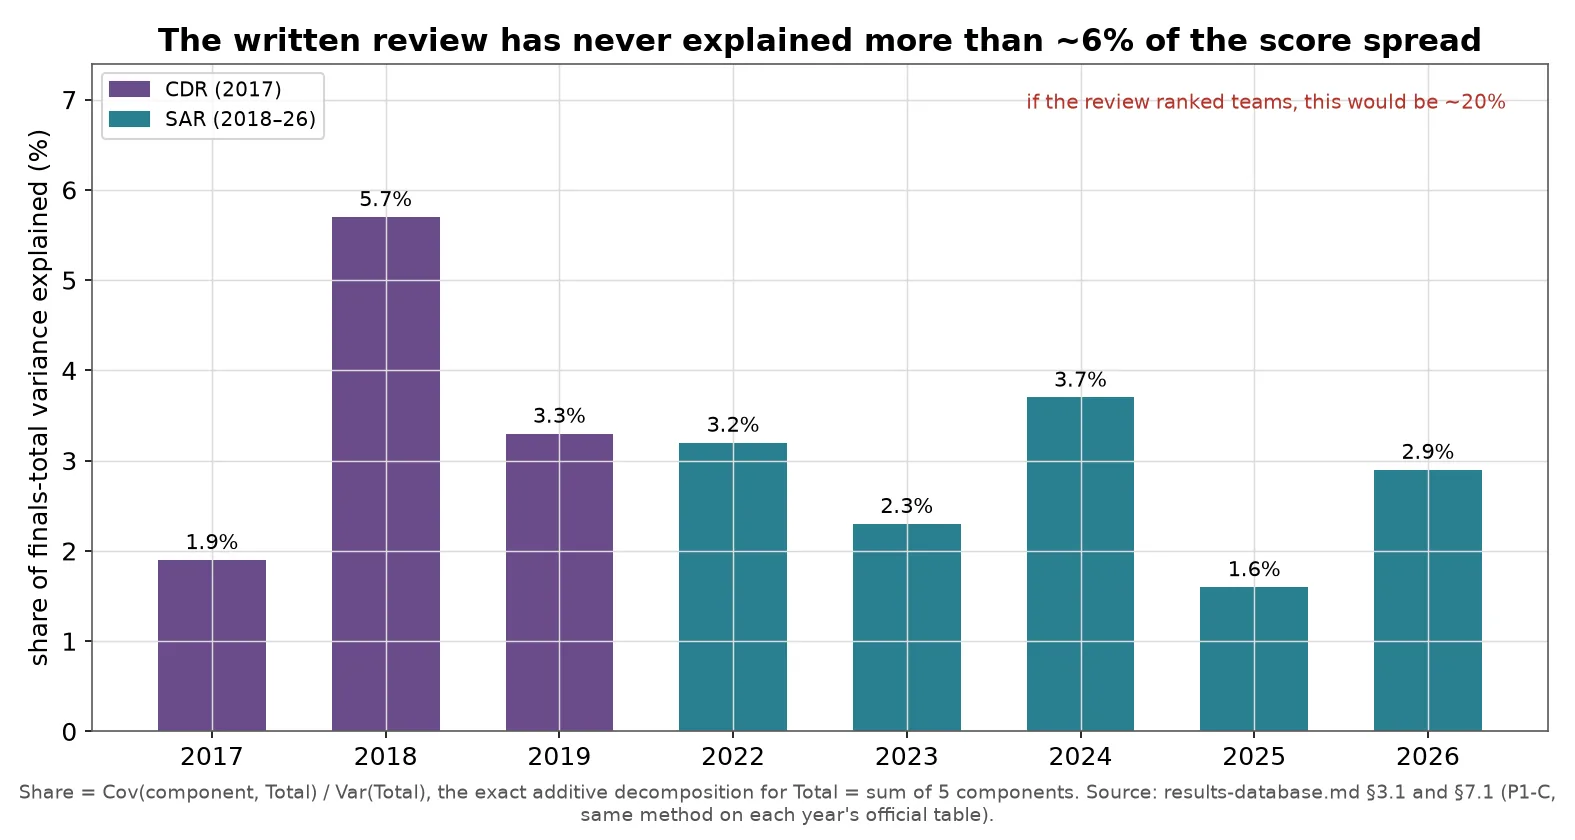
The interactive chart shows the pooled 2022–2026 shares. The static figure is a time series, so the two answer different questions: one is the pooled apportionment, the other its stability across ten years.
Where the gap is
| Component | Top five | Bottom ten | Gap | 2026 top eight | 2026 9–36 | 2026 gap |
|---|---|---|---|---|---|---|
| Review | 93.03 | 87.86 | +5.17 | 88.91 | 84.85 | +4.05 |
| Science | 89.53 | 68.69 | +20.83 | 93.88 | 74.05 | +19.83 |
| Delivery | 53.67 | 9.27 | +44.40 | 63.50 | 11.24 | +52.26 |
| Equipment Servicing | 59.02 | 9.84 | +49.18 | 64.94 | 18.90 | +46.04 |
| Autonomy | 59.39 | 3.71 | +55.68 | 70.90 | 14.07 | +56.83 |
| Total | 354.6 | 178.7 | +175.9 | 382.1 | 203.1 | +179.0 |
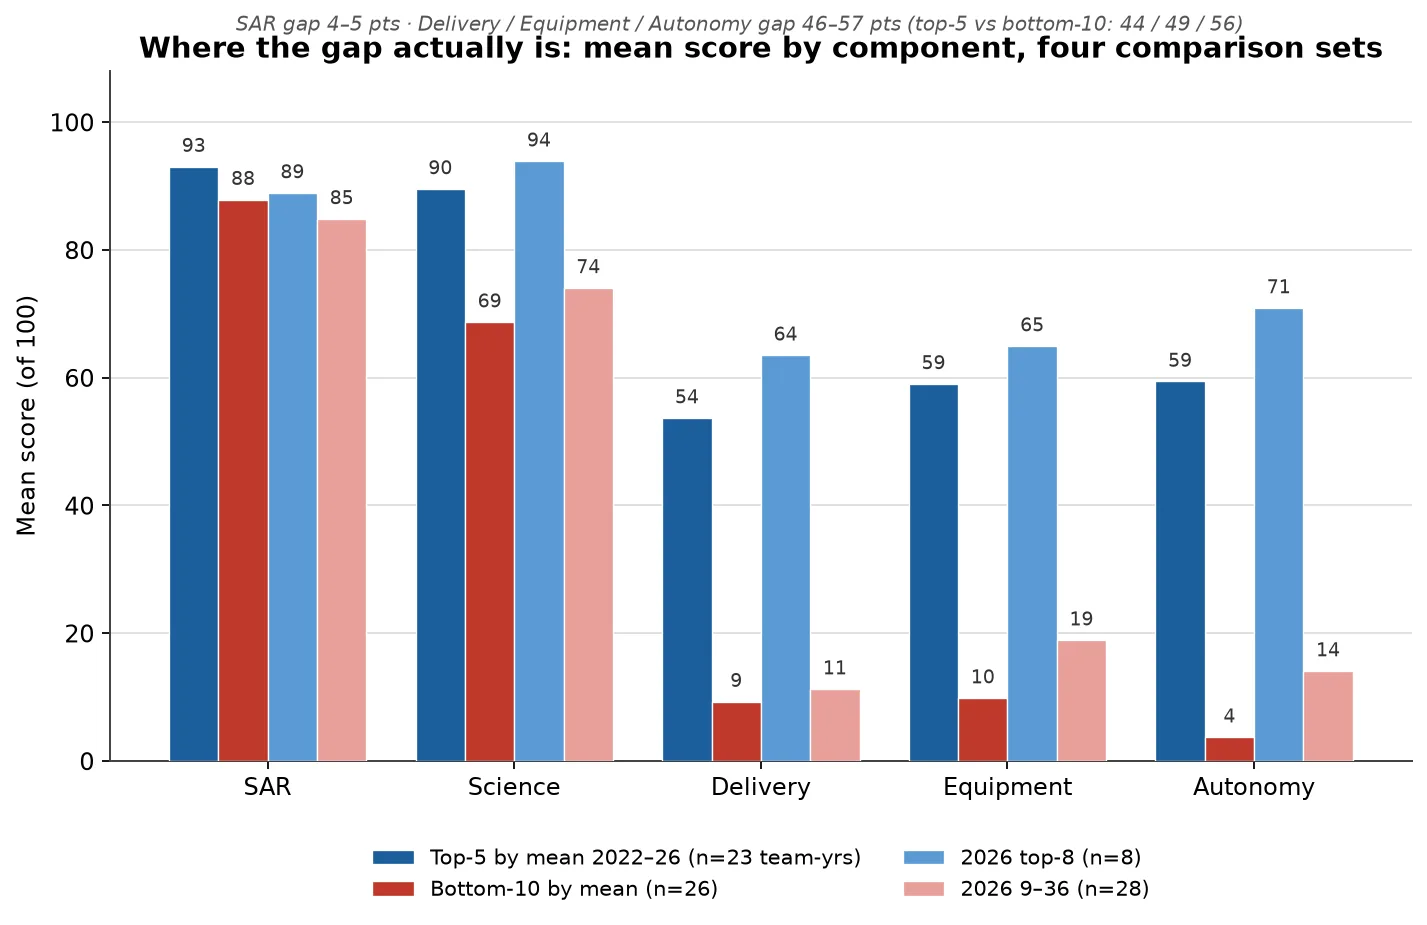
The bottom ten is a competent Science team with a broken manipulator and no autonomy. Science has the smallest gap of the four missions, which is why it is the wrong place to look for a differentiator. The 2026 top eight wins by completing: five of them share the same Autonomy score of 86 and the rest of the field averages 14.07 because 16 of 28 scored nothing.
Trajectories
| Team | 2022 | 2023 | 2024 | 2025 | 2026 |
|---|---|---|---|---|---|
| Missouri S&T | 370.71 | 298.24 | 341.54 | 412.27 | 469.57 |
| West Virginia | 268.67 | 425.35 | 391.80 | 396.17 | 376.70 |
| Monash | 380.55 | 354.83 | 247.35 | 320.61 | 412.41 |
| Michigan | 388.97 | 343.08 | 274.41 | 299.62 | 375.89 |
| AGH | 341.10 | 274.17 | 392.76 | review only | |
| UIU | 236.67 | 273.59 | 304.25 | 325.93 | 400.44 |
| Northeastern | 207.88 | 256.86 | 271.69 | 362.42 | 349.56 |
| Sooner | 271.65 | 260.12 | 238.01 | 179.79 |
Totals by year for the eight most informative programmes S-URC-RESULTS. An empty cell means the team did not record a finals score that year.
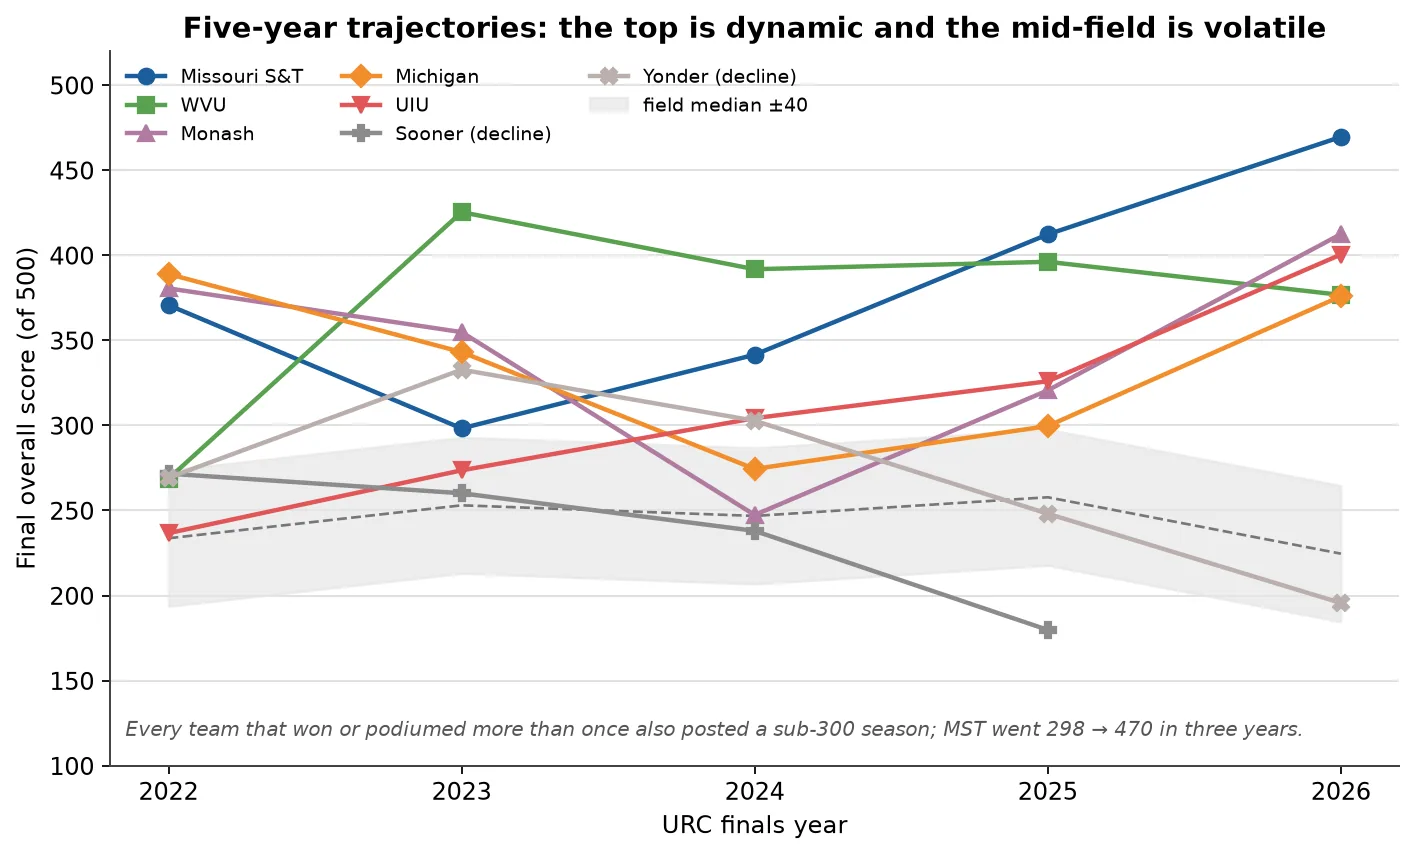
The interactive view plots seven of these programmes, including Yonder Dynamics, on one axis.
Four teams won in five years and eight teams took the fifteen podium places. The biggest sustained climb is UIU, from 13th in 2022 to 3rd in 2026 on a within-year z-score change of +1.91; the biggest fall is Sooner, from 7th to 32nd. A platform-change year costs a season: Monash rebuilt its arm and its autonomy stack in the same year and fell to 16th with 18 points in Equipment Servicing and none in Autonomy S-URC-RESULTS.
Consistency
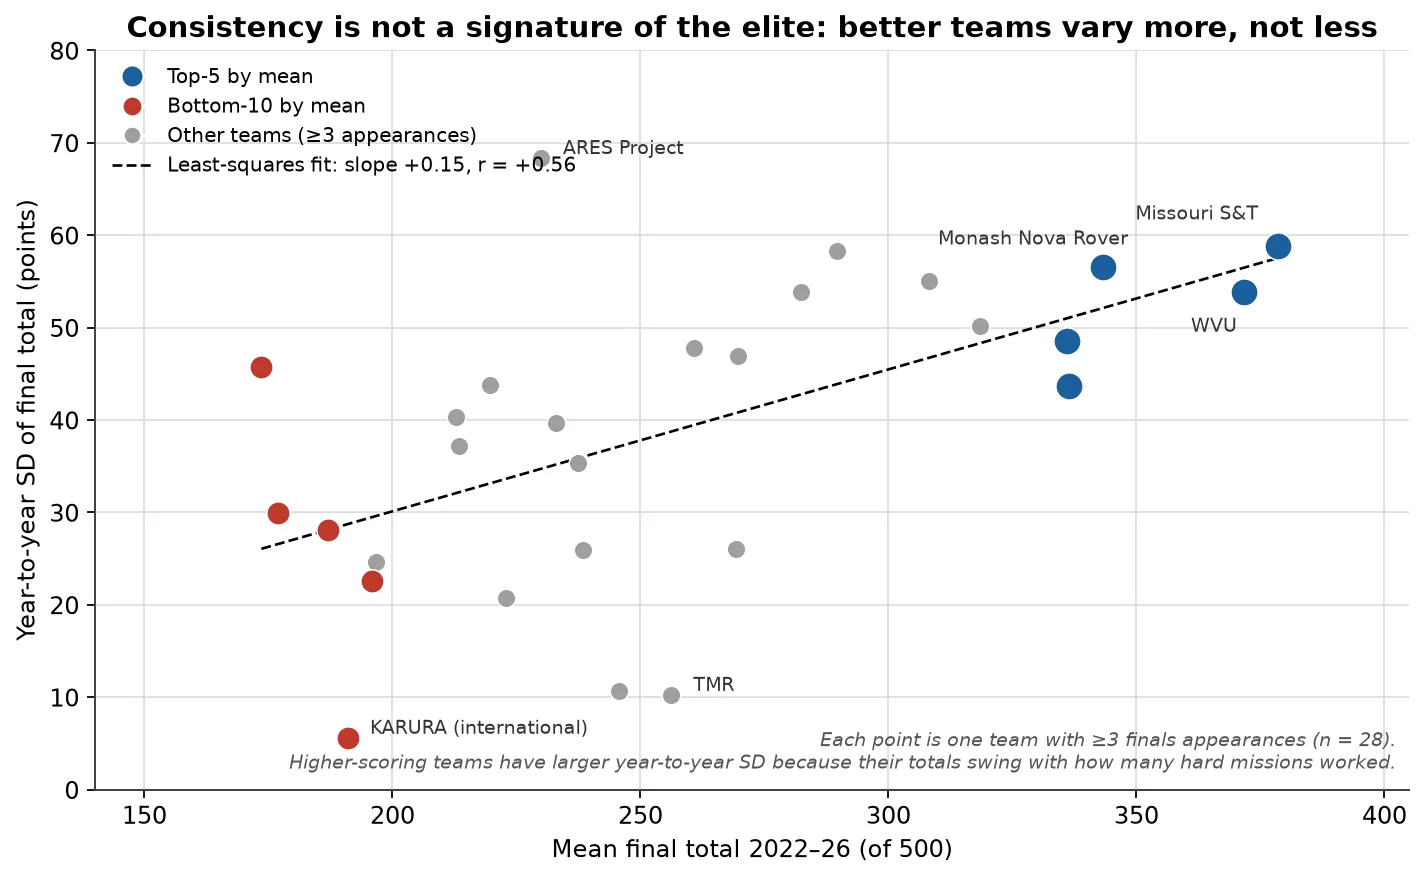
The top five’s year-to-year standard deviation is 52.3 against 26.4 for the bottom ten, and the correlation between a team’s mean total and its spread is +0.56 across the 28 teams with at least three appearances. The most stable totals in the data belong to KARURA at a standard deviation of 5.6 and a mean of 191, TMR at 10.2 and 256, and Project Scorpio at 10.7 and 246, all mid-field or lower. Consistency of the total is not a signature of the elite; consistency of completion is S-URC-RESULTS.
The values on this page
| Statistic | Value | Definition | Period | Sample | Source | Chart and chapter |
|---|---|---|---|---|---|---|
| Total gap | 175.9 | Top-five mean minus bottom-ten mean | 2022–2026 | 49 team-years | S-URC-RESULTS | How the top differs |
| Autonomy share | 30.6 % | Covariance with the total over its variance | 2022–2026 | 162 team-years | S-URC-RESULTS | Chart above; How the top differs |
| Review share | 2.8 % | Same method, written review | 2022–2026 | 162 team-years | S-URC-RESULTS | Chart above; Review and judging |
| Review gap | 5.2 | Top-five mean minus bottom-ten mean | 2022–2026 | 49 team-years | S-URC-RESULTS | How the top differs |
| 2026 set gap | 179.0 | Top eight minus places 9–36 | 2026 | 36 teams | S-URC26-SCORES | Results explorer |
| Trajectory spread | 52.3 against 26.4 | Year-to-year total SD, top five against bottom ten | 2022–2026 | 10 teams | S-URC-RESULTS | Chart above; Teams and hardware |
Evidence note
The variance decomposition attributes shared variance to the mission it co-varies with, so each share is an upper bound on that mission’s causal importance. The comparison sets are selected on a mean over at least two seasons, which rewards programmes that returned; 18 single-appearance teams are excluded from both sides. The qualitative comparison rests on four Tier A dossiers, all of them top eight in 2026, so it describes what the winners do and not what the losers fail to do. Country, funding and team size are not controlled.
Sources for this page
- S-URC-RESULTSURC official scores 2022–2026, compiled CSVPrint copy
- S-URC26-SCORESURC2026 Official ScoresOriginal Archived copy