Zeros and consistency
A zero is the clearest event in the score data: a team attempted a mission and recorded no points, or did not attempt it at all. Across 162 finals team-years from 2022 to 2026 there are 67 Autonomy zeros, 27 in Equipment Servicing and 25 in Delivery, and not one in Science. The cost is not proportional. A team with no zero averages rank 10.2; one zero moves it to 21.1 and removes about 85 points from the total. That is a step, not a slope, and it is the single strongest pattern in the results.
Key takeaways
- The three hard missions are bimodal. Delivery, Equipment Servicing and Autonomy have coefficients of variation of 0.67–1.15; Science has never recorded a zero and its coefficient is 0.14–0.26.
- One zero is worth about 11 places and 85 points. Mean total falls from 297.9 with no zero to 212.8 with one, and rank follows.
- Zeros cluster. An Equipment Servicing zero multiplies the chance of a Delivery zero by 2.9 and of an Autonomy zero by 2.1, the signature of one broken rover losing several missions.
- Autonomy is the persistent sink. About 610 of the roughly 945 mission points the field leaves to zeros each year are Autonomy points, and the rate has not improved in five years.
Zero rates by mission and year
Counts of teams scoring exactly zero, with the share of that year’s finals field in brackets.
| Year | Finalists | Science | Delivery | Equipment | Autonomy |
|---|---|---|---|---|---|
| 2022 | 26 | 0 | 8 (31 %) | 6 (23 %) | 12 (46 %) |
| 2023 | 31 | 0 | 2 (6 %) | 7 (23 %) | 15 (48 %) |
| 2024 | 34 | 0 | 2 (6 %) | 5 (15 %) | 17 (50 %) |
| 2025 | 35 | 0 | 1 (3 %) | 4 (11 %) | 7 (20 %) |
| 2026 | 36 | 0 | 12 (33 %) | 5 (14 %) | 16 (44 %) |
| Pooled | 162 | 0 | 25 (15.4 %) | 27 (16.7 %) | 67 (41.4 %) |
S-URC22-SCORES S-URC23-SCORES S-URC24-SCORES S-URC25-SCORES S-URC26-SCORES
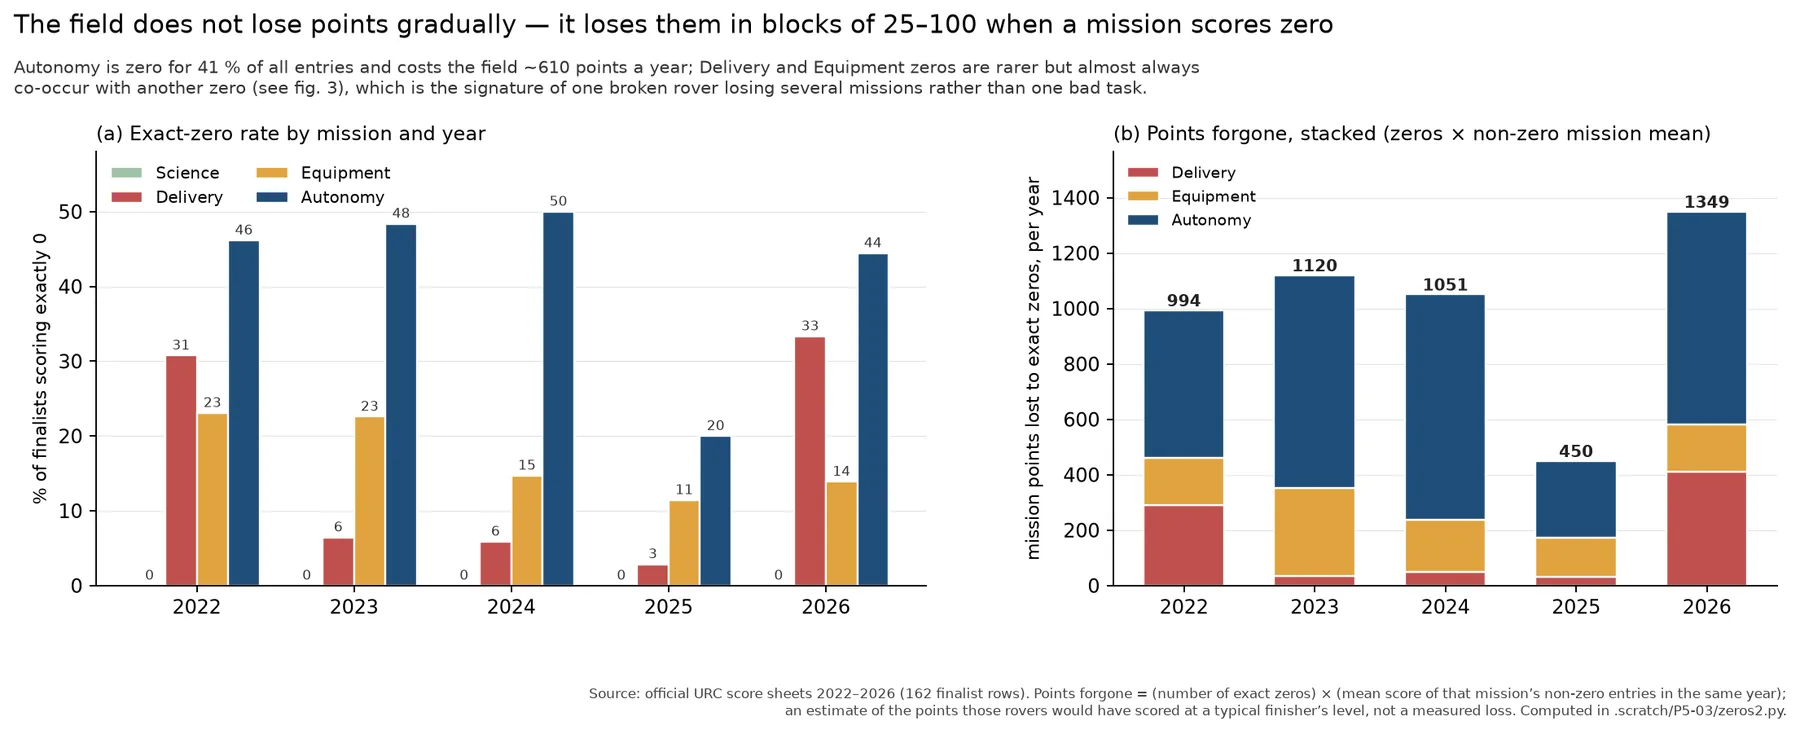
The interactive view plots the same rates on a 0–100 % scale. Science stays on the axis at zero, which is why the line is drawn at the bottom rather than omitted.
The cost of a zero
| Missions scored exactly zero | Team-years | Mean final rank | Mean total |
|---|---|---|---|
| 0 | 83 | 10.2 | 297.9 |
| 1 | 50 | 21.1 | 212.8 |
| 2 | 18 | 29.2 | 158.4 |
| 3 | 11 | 28.0 | 152.2 |
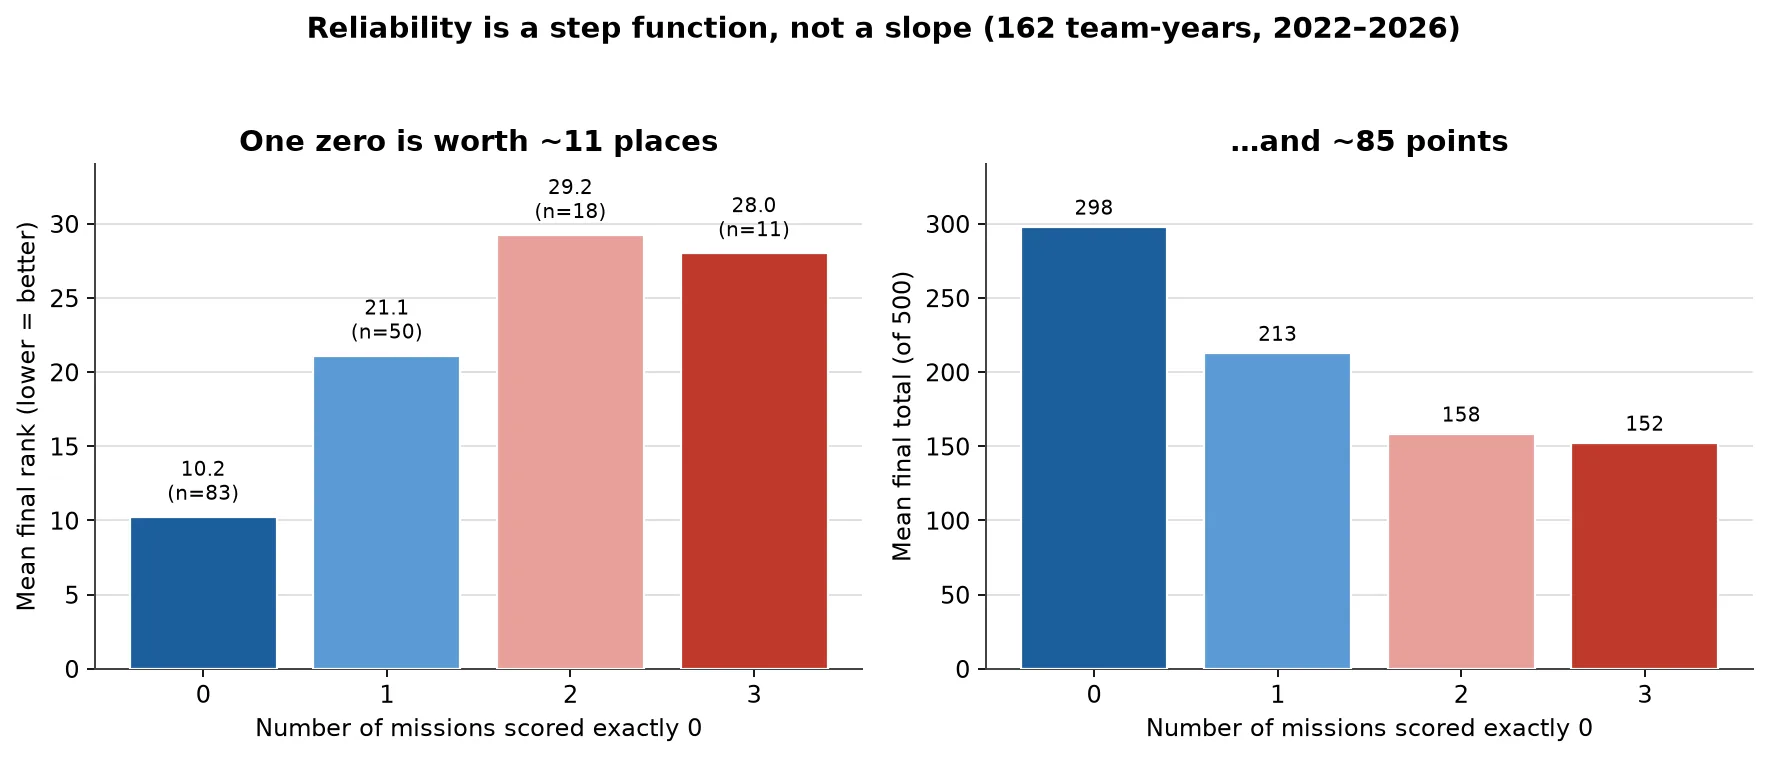
The isolated effect is the same for each mission: mean rank is 15.4 with a non-zero Delivery score against 25.1 with a zero, 14.6 against 28.6 for Equipment Servicing, and 11.7 against 24.3 for Autonomy. The Autonomy gap of 12.7 places is stable at 11.9 to 15.2 places in every year from 2022 to 2026 S-URC-RESULTS.
A zero is not one thing
The co-occurrence matrix is what separates a capability gap from an incident. A team that zeroes Equipment Servicing also zeroes Delivery 44 % of the time, 2.9 times the base rate, and Autonomy 85 % of the time, 2.1 times the base rate. A team that zeroes Delivery also zeroes Equipment Servicing 48 % of the time, again 2.9 times the base rate.
The Autonomy pattern is different. Of the 67 Autonomy zeros, 58 % are isolated: the rover scored in every other mission and simply could not complete the autonomous task. The other 42 % arrive with another zero and point to a rover-level failure. Equipment Servicing is the reverse: only 11 % of its zeros are isolated, so an Equipment zero usually signals a fault that took other missions down with it S-URC-RESULTS.
Points forgone
| Mission | Mean score when non-zero | Zeros a year | Points left to zeros a year |
|---|---|---|---|
| Delivery | 27.9 | 5.0 | 140 |
| Equipment Servicing | 36.3 | 5.4 | 196 |
| Autonomy | 45.5 | 13.4 | 610 |
| Total | ≈945 |
The yearly totals are 994, 1120, 1051, 450 and 1350 for 2022 to 2026 S-URC-RESULTS. Delivery is the volatile row: one zero in 2025 and twelve in 2026. Autonomy is the persistent one, and it is the largest single loss in the field.
Consistency means a floor, not a flat line
The word consistency needs care here. Team totals swing for good teams because the ceiling moves with the field: the top five’s year-to-year standard deviation is 52.3 against 26.4 for the bottom ten, and the correlation between a team’s mean total and its year-to-year spread is +0.56 across the 28 teams with at least three appearances S-URC-RESULTS. What is consistent about the elite is the absence of zeros, not the absence of variance. That comparison is worked in full on Top versus rest.
The values on this page
| Statistic | Value | Definition | Period | Sample | Source | Chart and chapter |
|---|---|---|---|---|---|---|
| Autonomy zero rate | 41.4 % | Share of finals entries scoring exactly zero | 2022–2026 | 162 team-years | S-URC-RESULTS | Chart above; Top versus rest |
| Delivery zero rate | 15.4 % | Same, Delivery mission | 2022–2026 | 162 team-years | S-URC-RESULTS | Analysis of failures |
| Equipment zero rate | 16.7 % | Same, Equipment Servicing | 2022–2026 | 162 team-years | S-URC-RESULTS | Analysis of failures |
| Science zero rate | 0 % | Same, Science mission | 2022–2026 | 162 team-years | S-URC-RESULTS | Scores and results |
| Rank with no zero | 10.2 | Mean final rank, 83 team-years | 2022–2026 | 83 team-years | S-URC-RESULTS | Top versus rest |
| Cost of one zero | 11 places, 85 points | Change from zero zeros to one | 2022–2026 | 133 team-years | S-URC-RESULTS | Top versus rest |
| Points left to zeros | ≈945 a year | Zeros times the non-zero mean | 2022–2026 | 162 team-years | S-URC-RESULTS | Analysis of failures |
Evidence note
The sheets record a final score, not an attempt: a zero can mean a failed attempt, an abandoned mission or a withdrawal, and the official data do not distinguish them. Zero rates and co-occurrence are therefore robust, while any claim about the cause of a specific zero is inference. The points-forgone figure prices every zero at the mean of the non-zero entries in the same mission and year, so it is an upper bound on what those teams would have scored.
Sources for this page
- S-URC22-SCORESURC2022 Official ScoresOriginal
- S-URC23-SCORESURC2023 Official ScoresOriginal
- S-URC24-SCORESURC2024 Official ScoresOriginal
- S-URC25-SCORESURC2025 Official ScoresOriginal
- S-URC26-SCORESURC2026 Official ScoresOriginal Archived copy
- S-URC-RESULTSURC official scores 2022–2026, compiled CSVPrint copy